| Date | Price $ | Result % | Candle Name | Side |
|---|---|---|---|---|
| 001 22 Mar 2024 | Sell Price: 124.84 | Loss: Close Day2 ($ 125.78) | Engulfing | Sell |
| 002 15 Sep 2023 | Sell Price: 132.18 | Profit: Close Day1 ($ 131.88) | Abandoned Baby | Sell |
| 003 26 Jun 2023 | Buy Price: 109.75 | Profit: Open Day1 ($ 109.78) | Abandoned Baby | Buy |
| 004 26 Jun 2023 | Buy Price: 110.00 | Profit: Close Day2 ($ 111.19) | Engulfing | Buy |
| 005 22 May 2023 | Sell Price: 113.55 | Profit: Close Day1 ($ 113.46) | Abandoned Baby | Sell |
| 006One Year Average | Both Sides Result for 5 Signals |
Profit: $ 0.67 ($ 0.13 / Signal) |
All of Them | Buy + Sell |
| Simple Moving Averages (SMA) Period | Value $ | Signal | Exponential Moving Averages (EMA) Period | Value $ | Signal | |
|---|---|---|---|---|---|---|
| 2 | 132.68 | SELL | 2 | 132.66 | SELL | |
| 3 | 132.58 | SELL | 3 | 133.01 | SELL | |
| 5 | 134.06 | SELL | 5 | 133.60 | SELL | |
| 8 | 135.10 | SELL | 8 | 133.78 | SELL | |
| 13 | 134.35 | SELL | 13 | 133.00 | SELL | |
| 21 | 131.19 | BUY | 21 | 130.97 | BUY | |
| 34 | 126.62 | BUY | 34 | 127.99 | BUY | |
| 55 | 121.42 | BUY | 55 | 125.12 | BUY | |
| 90 | 120.00 | BUY | 90 | 123.28 | BUY | |
| 200 | 123.63 | BUY | 200 | 122.12 | BUY |
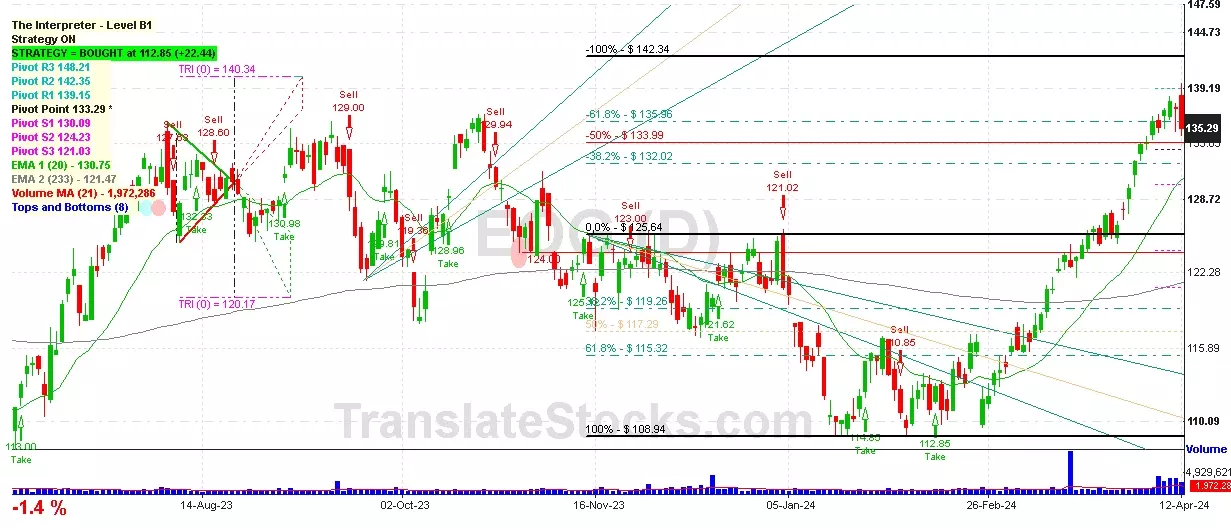
Eog Resources Inc
IPO: 1989-10-04
Ticker: EOGIndices: S&P 500,
Exchange: New York Stock Exchange, Inc. (US - USD)
Website: http://www.eogresources.com
Phone:
Common Stock
Energy & Transportation (
Crude Petroleum & Natural Gas

 Click to Enlarge