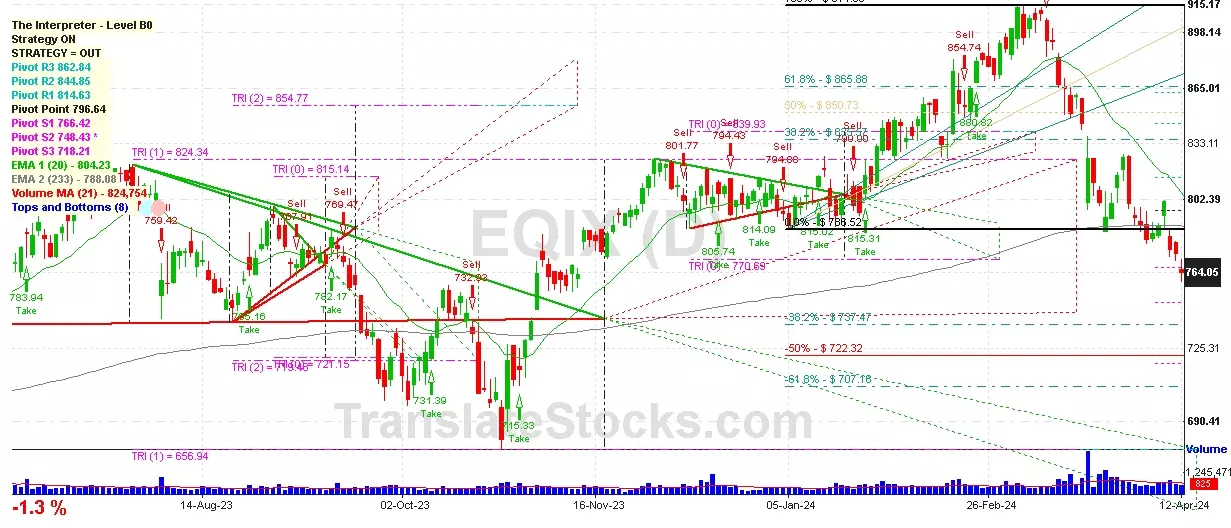
| Date | Price $ | Result % | Candle Name | Side |
|---|---|---|---|---|
| 001 01 Apr 2024 | Sell Price: 800.05 | Profit: Open Day1 ($ 793.99) | Engulfing | Sell |
| 002 11 Mar 2024 | Sell Price: 893.56 | Profit: Close Day1 ($ 892.81) | Abandoned Baby | Sell |
| 003 21 Feb 2024 | Buy Price: 864.73 | Profit: Open Day1 ($ 868.36) | Engulfing | Buy |
| 004 26 Jan 2024 | Sell Price: 810.98 | Profit: Open Day1 ($ 809.94) | Dark Cloud Cover | Sell |
| 005 29 Dec 2023 | Sell Price: 805.39 | Profit: Open Day1 ($ 802.74) | Abandoned Baby | Sell |
| 006 14 Dec 2023 | Sell Price: 803.52 | Profit: Open Day1 ($ 800.48) | Engulfing | Sell |
| 007 14 Dec 2023 | Sell Price: 805.29 | Profit: Open Day1 ($ 800.48) | Dark Cloud Cover | Sell |
| 008 14 Nov 2023 | Buy Price: 786.03 | Loss: Close Day2 ($ 780.37) | Abandoned Baby | Buy |
| 009 13 Nov 2023 | Sell Price: 762.54 | Loss: Close Day2 ($ 781.00) | Abandoned Baby | Sell |
| 010 03 Jul 2023 | Sell Price: 783.36 | Profit: Open Day2 ($ 783.19) | Abandoned Baby | Sell |
| 011 26 Jun 2023 | Buy Price: 759.94 | Profit: Close Day1 ($ 765.22) | Abandoned Baby | Buy |
| 012 23 May 2023 | Sell Price: 696.81 | Profit: Open Day1 ($ 692.44) | Abandoned Baby | Sell |
| 013One Year Average | Both Sides Result for 12 Signals |
Profit: $ 7.67 ($ 0.64 / Signal) |
All of Them | Buy + Sell |
| Simple Moving Averages (SMA) Period | Value $ | Signal | Exponential Moving Averages (EMA) Period | Value $ | Signal | |
|---|---|---|---|---|---|---|
| 2 | 737.21 | BUY | 2 | 739.30 | BUY | |
| 3 | 738.85 | BUY | 3 | 741.07 | SELL | |
| 5 | 744.94 | SELL | 5 | 746.72 | SELL | |
| 8 | 759.47 | SELL | 8 | 755.32 | SELL | |
| 13 | 770.07 | SELL | 13 | 768.08 | SELL | |
| 21 | 784.84 | SELL | 21 | 784.84 | SELL | |
| 34 | 823.18 | SELL | 34 | 801.97 | SELL | |
| 55 | 836.38 | SELL | 55 | 812.60 | SELL | |
| 90 | 824.29 | SELL | 90 | 812.79 | SELL | |
| 200 | 792.51 | SELL | 200 | 791.98 | SELL |
Equinix Inc
IPO: 2000-08-11
Ticker: EQIXIndices: S&P 500,
Exchange: Nasdaq Nms - Global Market (US - USD)
Website: https://www.equinix.com/
Phone:
REIT (Real Estate Investment Trust)
Real Estate & Construction (
Real Estate Investment Trusts
 Click to Enlarge