| Date | Price $ | Result % | Candle Name | Side |
|---|---|---|---|---|
| 001 01 Apr 2024 | Sell Price: 65.90 | Profit: Open Day1 ($ 64.90) | Abandoned Baby | Sell |
| 002 13 Feb 2024 | Sell Price: 74.39 | Loss: Close Day2 ($ 77.76) | Abandoned Baby | Sell |
| 003 02 Nov 2023 | Buy Price: 61.63 | Profit: Open Day1 ($ 63.62) | Engulfing | Buy |
| 004 02 Nov 2023 | Buy Price: 61.61 | Profit: Open Day1 ($ 63.62) | Piercing Line | Buy |
| 005 30 Oct 2023 | Sell Price: 61.31 | Profit: Close Day2 ($ 60.66) | Engulfing | Sell |
| 006 24 Oct 2023 | Buy Price: 64.59 | Loss: Close Day2 ($ 62.37) | Abandoned Baby | Buy |
| 007 01 May 2023 | Sell Price: 96.27 | Profit: Open Day1 ($ 94.56) | Abandoned Baby | Sell |
| 008One Year Average | Both Sides Result for 7 Signals |
Profit: $ 1.77 ($ 0.25 / Signal) |
All of Them | Buy + Sell |
| Simple Moving Averages (SMA) Period | Value $ | Signal | Exponential Moving Averages (EMA) Period | Value $ | Signal | |
|---|---|---|---|---|---|---|
| 2 | 67.93 | SELL | 2 | 67.62 | SELL | |
| 3 | 67.53 | SELL | 3 | 67.61 | SELL | |
| 5 | 67.61 | SELL | 5 | 67.53 | SELL | |
| 8 | 67.56 | SELL | 8 | 67.38 | BUY | |
| 13 | 66.71 | BUY | 13 | 67.29 | BUY | |
| 21 | 66.99 | BUY | 21 | 67.54 | SELL | |
| 34 | 67.87 | SELL | 34 | 68.31 | SELL | |
| 55 | 70.26 | SELL | 55 | 69.47 | SELL | |
| 90 | 73.06 | SELL | 90 | 70.90 | SELL | |
| 200 | 73.60 | SELL | 200 | 76.79 | SELL |
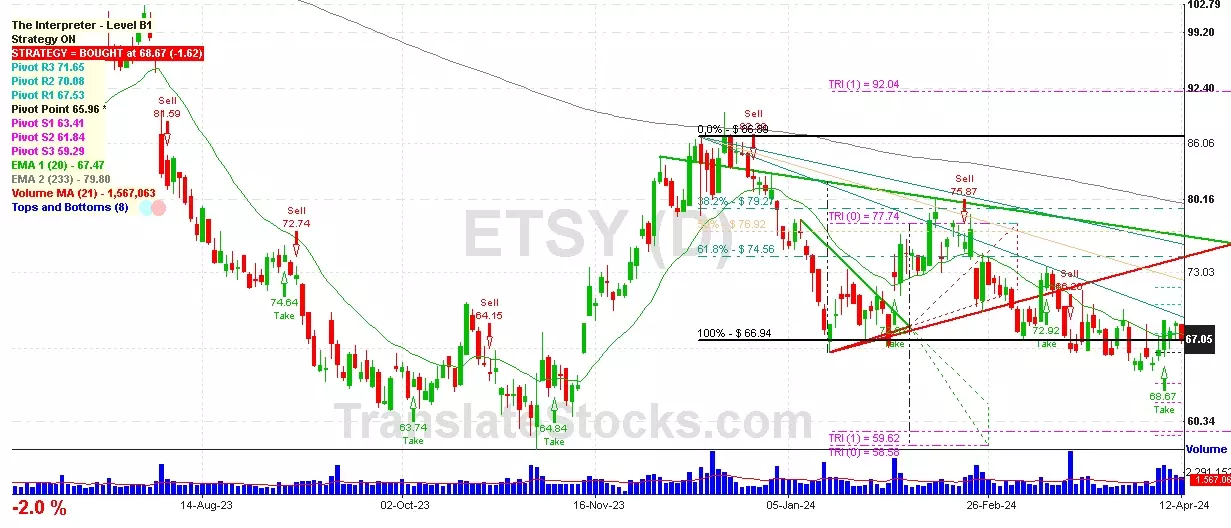
Etsy Inc
IPO: 2015-04-16
Ticker: ETSYIndices: S&P 500,
Exchange: Nasdaq Nms - Global Market (US - USD)
Website: https://www.etsy.com/
Phone:
Common Stock
Trade & Services (
Services-business Services, Nec

 Click to Enlarge