| Date | Price $ | Result % | Candle Name | Side |
|---|---|---|---|---|
| 001 08 Apr 2024 | Buy Price: 52.78 | Profit: Open Day1 ($ 53.02) | Engulfing | Buy |
| 002 15 Mar 2024 | Buy Price: 51.60 | Profit: Close Day1 ($ 51.76) | Engulfing | Buy |
| 003 23 Feb 2024 | Buy Price: 50.57 | Loss: Close Day2 ($ 50.20) | Engulfing | Buy |
| 004 22 Feb 2024 | Sell Price: 50.26 | Profit: Open Day1 ($ 50.19) | Abandoned Baby | Sell |
| 005 15 Dec 2023 | Sell Price: 51.76 | Profit: Close Day1 ($ 51.46) | Abandoned Baby | Sell |
| 006 12 Dec 2023 | Sell Price: 51.35 | Loss: Close Day2 ($ 53.37) | Engulfing | Sell |
| 007 22 Nov 2023 | Buy Price: 50.83 | Profit: Open Day1 ($ 50.92) | Abandoned Baby | Buy |
| 008 24 Aug 2023 | Sell Price: 56.23 | Loss: Close Day2 ($ 56.72) | Abandoned Baby | Sell |
| 009 10 Aug 2023 | Sell Price: 58.01 | Profit: Close Day2 ($ 57.63) | Engulfing | Sell |
| 010 28 Jun 2023 | Sell Price: 57.60 | Profit: Open Day1 ($ 57.27) | Abandoned Baby | Sell |
| 011 28 Jun 2023 | Sell Price: 57.70 | Profit: Open Day1 ($ 57.27) | Engulfing | Sell |
| 012 09 Jun 2023 | Sell Price: 59.40 | Profit: Open Day2 ($ 59.16) | Engulfing | Sell |
| 013 02 Jun 2023 | Buy Price: 57.73 | Profit: Open Day1 ($ 57.88) | Piercing Line | Buy |
| 014 01 May 2023 | Buy Price: 62.47 | Loss: Close Day2 ($ 61.68) | Engulfing | Buy |
| 015One Year Average | Both Sides Result for 14 Signals |
Loss: $ -1.28 ($ -0.09 / Signal) |
All of Them | Buy + Sell |
| Simple Moving Averages (SMA) Period | Value $ | Signal | Exponential Moving Averages (EMA) Period | Value $ | Signal | |
|---|---|---|---|---|---|---|
| 2 | 50.05 | BUY | 2 | 50.33 | BUY | |
| 3 | 50.16 | BUY | 3 | 50.38 | BUY | |
| 5 | 50.58 | SELL | 5 | 50.64 | SELL | |
| 8 | 51.29 | SELL | 8 | 51.00 | SELL | |
| 13 | 51.82 | SELL | 13 | 51.34 | SELL | |
| 21 | 51.91 | SELL | 21 | 51.48 | SELL | |
| 34 | 51.51 | SELL | 34 | 51.44 | SELL | |
| 55 | 50.93 | SELL | 55 | 51.34 | SELL | |
| 90 | 51.34 | SELL | 90 | 51.45 | SELL | |
| 200 | 52.69 | SELL | 200 | 53.02 | SELL |
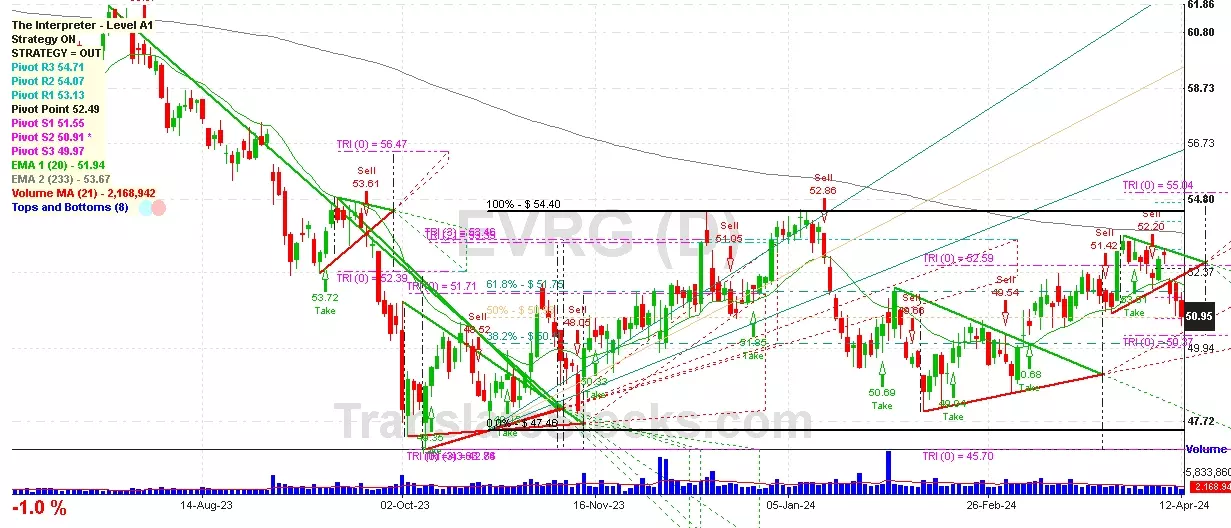
Evergy Inc
IPO: 2007-12-18
Ticker: EVRGIndices: S&P 500,
Exchange: New York Stock Exchange, Inc. (US - USD)
Website: http://www.evergyinc.com
Phone:
Common Stock
Energy & Transportation (
Electric & Other Services Combined

 Click to Enlarge