| Date | Price $ | Result % | Candle Name | Side |
|---|---|---|---|---|
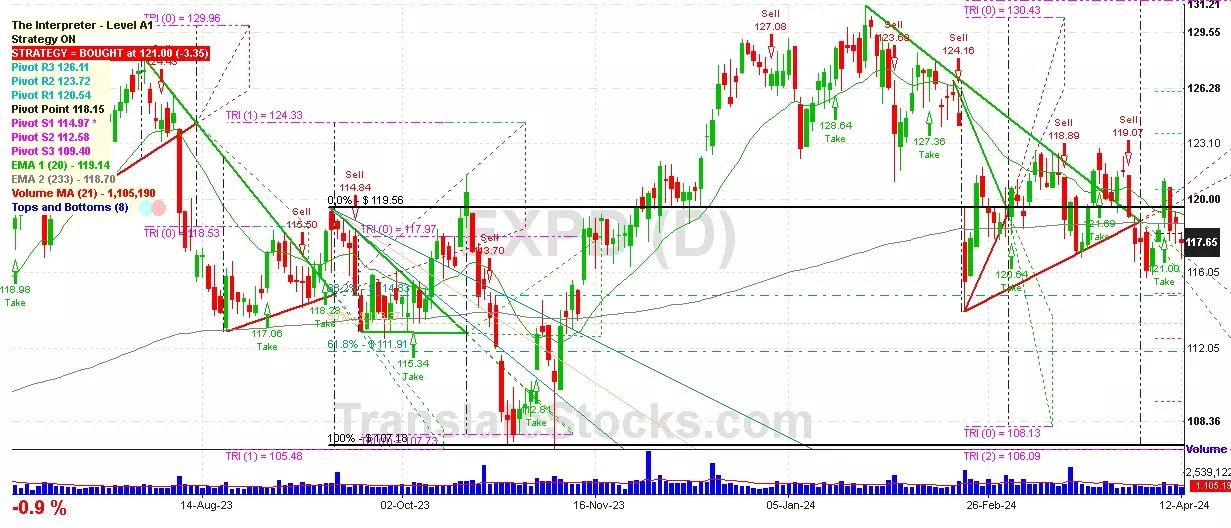
| 001 01 Apr 2024 | Sell Price: 119.07 | Profit: Open Day1 ($ 118.40) | Abandoned Baby | Sell |
| 002 25 Mar 2024 | Sell Price: 120.06 | Profit: Close Day1 ($ 119.94) | Abandoned Baby | Sell |
| 003 08 Mar 2024 | Sell Price: 121.26 | Profit: Open Day1 ($ 120.90) | Engulfing | Sell |
| 004 09 Feb 2024 | Buy Price: 127.36 | Loss: Close Day2 ($ 125.26) | Engulfing | Buy |
| 005 02 Feb 2024 | Buy Price: 124.33 | Profit: Close Day1 ($ 124.57) | Piercing Line | Buy |
| 006 08 Jan 2024 | Sell Price: 126.27 | Profit: Open Day1 ($ 125.34) | Engulfing | Sell |
| 007 08 Nov 2023 | Buy Price: 113.21 | Profit: Open Day1 ($ 114.00) | Engulfing | Buy |
| 008 30 May 2023 | Sell Price: 115.10 | Profit: Open Day1 ($ 114.06) | Dark Cloud Cover | Sell |
| 009 17 May 2023 | Buy Price: 113.45 | Profit: Open Day1 ($ 113.66) | Abandoned Baby | Buy |
| 010One Year Average | Both Sides Result for 9 Signals |
Profit: $ 2.26 ($ 0.25 / Signal) |
All of Them | Buy + Sell |
| Simple Moving Averages (SMA) Period | Value $ | Signal | Exponential Moving Averages (EMA) Period | Value $ | Signal | |
|---|---|---|---|---|---|---|
| 2 | 113.58 | SELL | 2 | 113.48 | SELL | |
| 3 | 113.92 | SELL | 3 | 113.77 | SELL | |
| 5 | 114.17 | SELL | 5 | 114.31 | SELL | |
| 8 | 115.11 | SELL | 8 | 115.01 | SELL | |
| 13 | 116.51 | SELL | 13 | 115.92 | SELL | |
| 21 | 117.52 | SELL | 21 | 116.94 | SELL | |
| 34 | 118.60 | SELL | 34 | 118.13 | SELL | |
| 55 | 120.06 | SELL | 55 | 119.33 | SELL | |
| 90 | 122.67 | SELL | 90 | 120.02 | SELL | |
| 200 | 119.83 | SELL | 200 | 118.90 | SELL |
Expeditors Intl Wash Inc
IPO: 2005-06-06
Ticker: EXPDIndices: S&P 500,
Exchange: Nasdaq Nms - Global Market (US - USD)
Website: https://www.expeditors.com/
Phone:
Common Stock
Energy & Transportation (
Arrangement Of Transportation Of Freight & Cargo

 Click to Enlarge