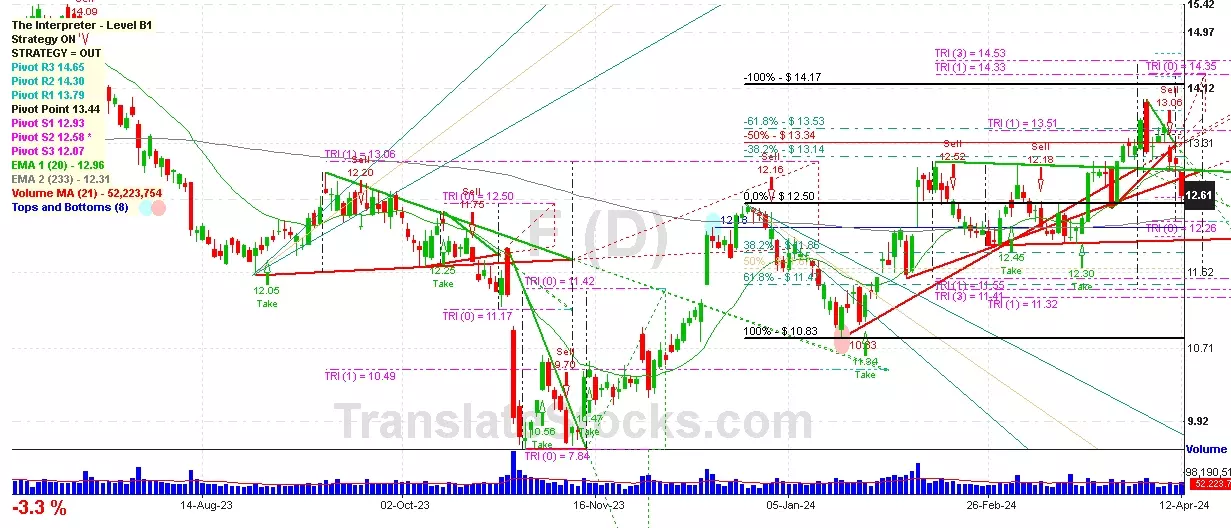
Hey Friend, I'm analysing FORD MOTOR CO (F), and it is between the Support of $ 12.58 (PivotS2) and the Resistance of $ 12.93 (PivotS1). The stock is also approaching the line of PivotS2 at $ 12.58, and if it goes below this line it could reach the next Support of Triangle projection at $12.50.

| Date | Price $ | Result % | Candle Name | Side |
|---|---|---|---|---|
| 001 02 Apr 2024 | Sell Price: 13.28 | Profit: Open Day1 ($ 13.25) | Abandoned Baby | Sell |
| 002 22 Mar 2024 | Sell Price: 12.91 | Profit: Close Day1 ($ 12.90) | Abandoned Baby | Sell |
| 003 18 Mar 2024 | Buy Price: 12.18 | Profit: Close Day1 ($ 12.30) | Abandoned Baby | Buy |
| 004 31 Jan 2024 | Sell Price: 11.72 | Loss: Close Day2 ($ 12.14) | Abandoned Baby | Sell |
| 005 24 Jan 2024 | Sell Price: 11.03 | Loss: Close Day2 ($ 11.39) | Engulfing | Sell |
| 006 14 Sep 2023 | Sell Price: 12.62 | Profit: Open Day1 ($ 12.40) | Abandoned Baby | Sell |
| 007 05 Sep 2023 | Sell Price: 12.09 | Profit: Open Day1 ($ 12.00) | Abandoned Baby | Sell |
| 008 31 May 2023 | Sell Price: 12.00 | Loss: Close Day2 ($ 12.39) | Abandoned Baby | Sell |
| 009 23 May 2023 | Buy Price: 11.73 | Loss: Close Day2 ($ 11.38) | Engulfing | Buy |
| 010 23 May 2023 | Buy Price: 11.72 | Loss: Close Day2 ($ 11.38) | Piercing Line | Buy |
| 011One Year Average | Both Sides Result for 10 Signals |
Loss: $ -1.39 ($ -0.14 / Signal) |
All of Them | Buy + Sell |
| Simple Moving Averages (SMA) Period | Value $ | Signal | Exponential Moving Averages (EMA) Period | Value $ | Signal | |
|---|---|---|---|---|---|---|
| 2 | 12.10 | BUY | 2 | 12.12 | BUY | |
| 3 | 12.08 | BUY | 3 | 12.13 | BUY | |
| 5 | 12.11 | BUY | 5 | 12.22 | SELL | |
| 8 | 12.41 | SELL | 8 | 12.38 | SELL | |
| 13 | 12.80 | SELL | 13 | 12.55 | SELL | |
| 21 | 12.88 | SELL | 21 | 12.63 | SELL | |
| 34 | 12.67 | SELL | 34 | 12.60 | SELL | |
| 55 | 12.54 | SELL | 55 | 12.47 | SELL | |
| 90 | 12.22 | SELL | 90 | 12.29 | SELL | |
| 200 | 12.10 | BUY | 200 | 12.23 | SELL |
Ford Motor Co
IPO: 1956-03-07
Ticker: FIndices: S&P 500,
Exchange: New York Stock Exchange, Inc. (US - USD)
Website: https://www.ford.com/
Phone:
Common Stock
Manufacturing (
Motor Vehicles & Passenger Car Bodies
 Click to Enlarge