| Date | Price $ | Result % | Candle Name | Side |
|---|---|---|---|---|
| 001 08 Jan 2024 | Buy Price: 62.47 | Profit: Close Day1 ($ 62.53) | Abandoned Baby | Buy |
| 002 08 Dec 2023 | Sell Price: 62.29 | Loss: Close Day2 ($ 63.88) | Abandoned Baby | Sell |
| 003 26 Oct 2023 | Buy Price: 57.24 | Profit: Close Day1 ($ 57.61) | Abandoned Baby | Buy |
| 004 13 Sep 2023 | Buy Price: 54.70 | Profit: Open Day1 ($ 55.11) | Abandoned Baby | Buy |
| 005 30 May 2023 | Sell Price: 54.90 | Profit: Close Day1 ($ 53.85) | Dark Cloud Cover | Sell |
| 006 11 May 2023 | Buy Price: 54.87 | Profit: Open Day1 ($ 55.00) | Piercing Line | Buy |
| 007One Year Average | Both Sides Result for 6 Signals |
Profit: $ 0.43 ($ 0.07 / Signal) |
All of Them | Buy + Sell |
| Simple Moving Averages (SMA) Period | Value $ | Signal | Exponential Moving Averages (EMA) Period | Value $ | Signal | |
|---|---|---|---|---|---|---|
| 2 | 67.48 | BUY | 2 | 67.52 | SELL | |
| 3 | 67.51 | SELL | 3 | 67.60 | SELL | |
| 5 | 67.70 | SELL | 5 | 67.98 | SELL | |
| 8 | 68.39 | SELL | 8 | 68.81 | SELL | |
| 13 | 70.78 | SELL | 13 | 70.14 | SELL | |
| 21 | 72.99 | SELL | 21 | 71.47 | SELL | |
| 34 | 74.11 | SELL | 34 | 72.17 | SELL | |
| 55 | 73.02 | SELL | 55 | 71.73 | SELL | |
| 90 | 70.17 | SELL | 90 | 69.96 | SELL | |
| 200 | 63.40 | BUY | 200 | 65.13 | BUY |
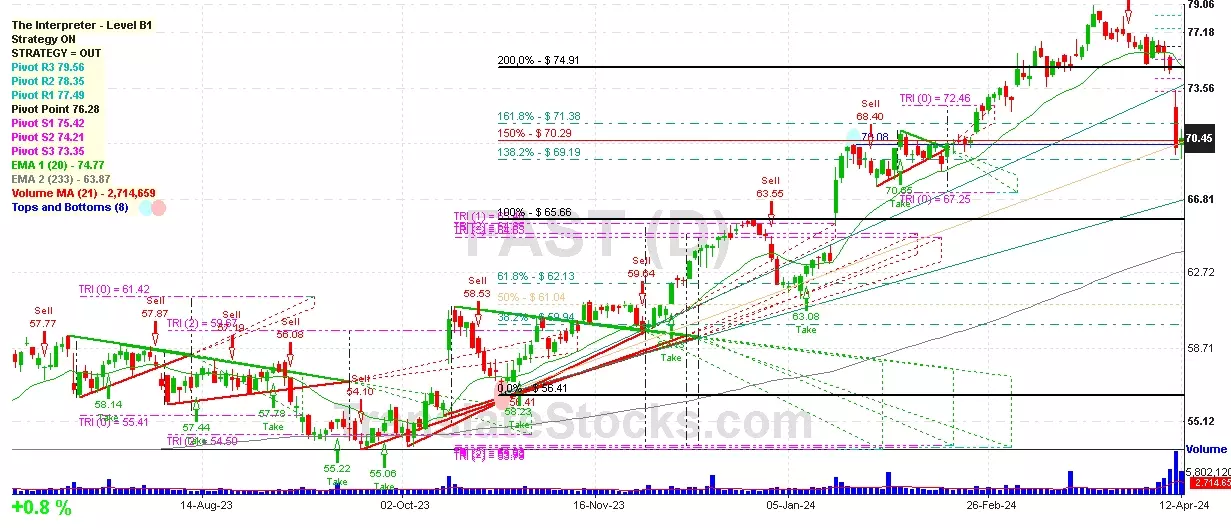
Fastenal Co
IPO: 1987-08-01
Ticker: FASTIndices: S&P 500,
Nasdaq 100,
Exchange: Nasdaq Nms - Global Market (US - USD)
Website: https://www.fastenal.com/
Phone:
Common Stock
Trade & Services (
Retail-building Materials, Hardware, Garden Supply

 Click to Enlarge