Hey Friend, I'm analysing META PLATFORMS INC CLASS A (FB), and it is between the Support of $ 192.24 (Pivot) and the Resistance of $ 199.48 (PivotR1). The stock is also approaching the line of PivotR1 at $ 199.48, and if it goes above this line it could reach the next Resistance of 61.8% of Fibonacci at $ 240.31.

| Date | Price $ | Result % | Candle Name | Side | No Candlesticks to Show Yet. |
|---|
| Simple Moving Averages (SMA) Period | Value $ | Signal | Exponential Moving Averages (EMA) Period | Value $ | Signal | |
|---|---|---|---|---|---|---|
| 2 | 173.44 | BUY | 2 | 175.23 | BUY | |
| 3 | 172.37 | BUY | 3 | 173.68 | BUY | |
| 5 | 170.90 | BUY | 5 | 171.79 | BUY | |
| 8 | 169.26 | BUY | 8 | 170.11 | BUY | |
| 13 | 166.41 | BUY | 13 | 168.79 | BUY | |
| 21 | 168.21 | BUY | 21 | 168.28 | BUY | |
| 34 | 166.95 | BUY | 34 | 169.54 | BUY | |
| 55 | 171.23 | BUY | 55 | 174.43 | BUY | |
| 90 | 179.79 | SELL | 90 | 186.44 | SELL | |
| 200 | 195.25 | SELL | 200 | 222.79 | SELL |
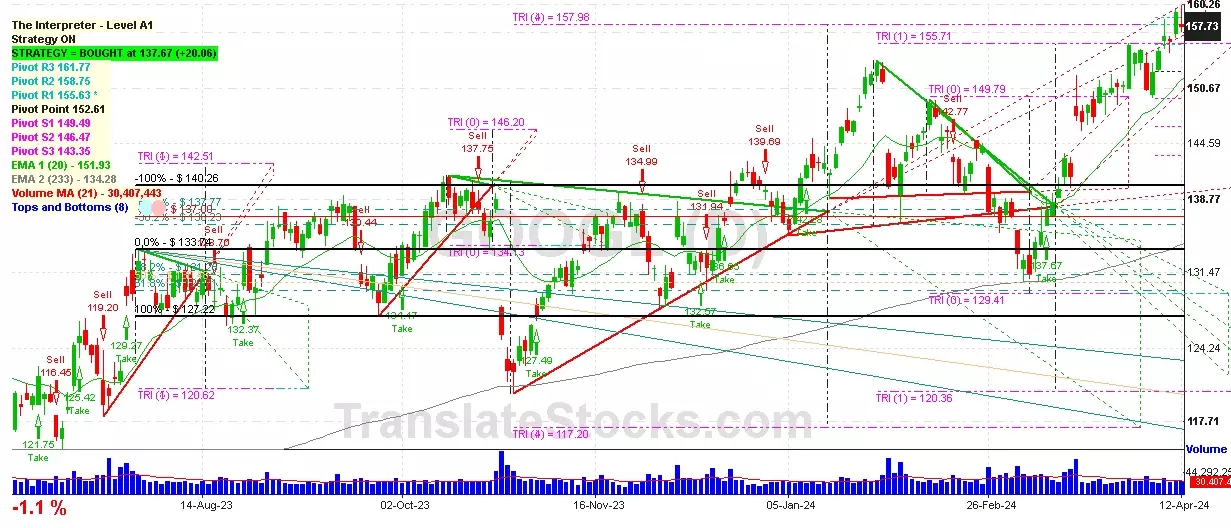
 Click to Enlarge
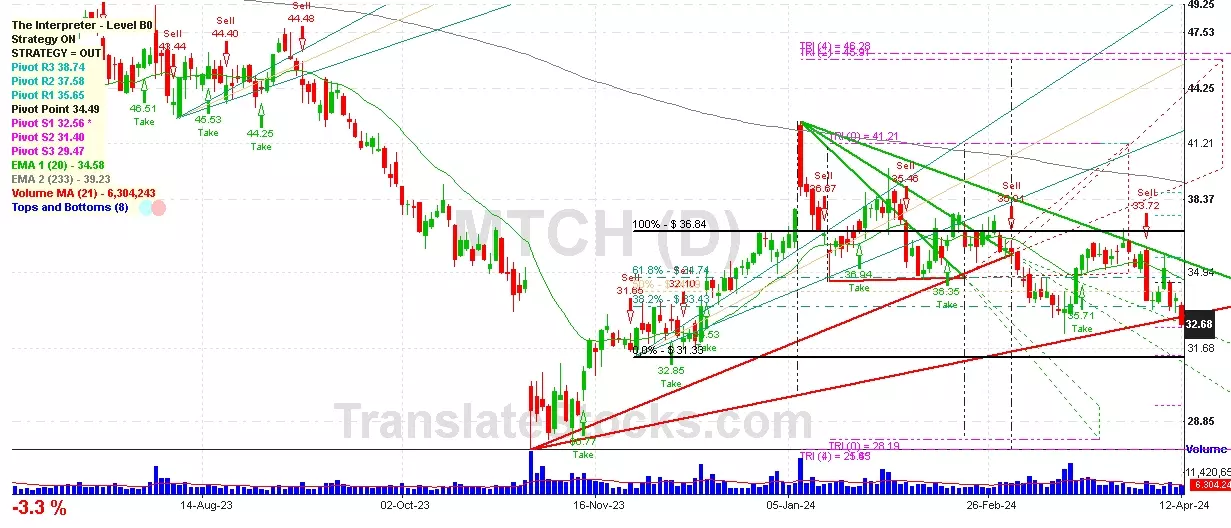