| Date | Price $ | Result % | Candle Name | Side |
|---|---|---|---|---|
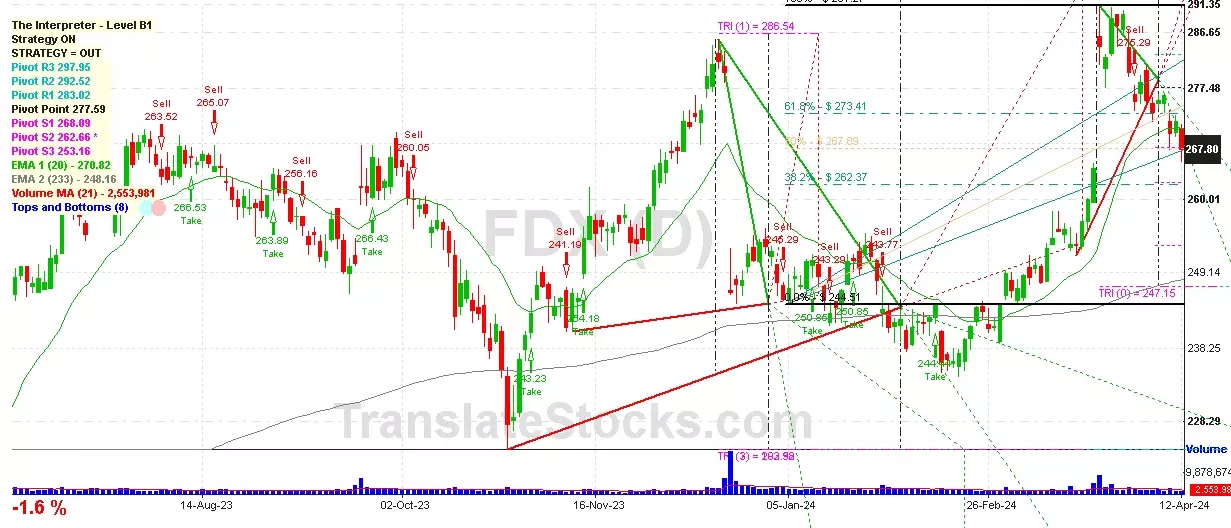
| 001 26 Jan 2024 | Sell Price: 251.55 | Profit: Open Day1 ($ 250.86) | Engulfing | Sell |
| 002 27 Dec 2023 | Sell Price: 250.94 | Profit: Open Day1 ($ 250.78) | Dark Cloud Cover | Sell |
| 003 15 Sep 2023 | Sell Price: 254.08 | Profit: Open Day1 ($ 253.79) | Dark Cloud Cover | Sell |
| 004 11 Sep 2023 | Buy Price: 254.70 | Loss: Close Day2 ($ 252.16) | Abandoned Baby | Buy |
| 005 30 Jun 2023 | Sell Price: 247.90 | Profit: Open Day1 ($ 247.11) | Engulfing | Sell |
| 006 19 May 2023 | Sell Price: 229.08 | Profit: Open Day1 ($ 229.02) | Engulfing | Sell |
| 007One Year Average | Both Sides Result for 6 Signals |
Loss: $ -0.55 ($ -0.09 / Signal) |
All of Them | Buy + Sell |
| Simple Moving Averages (SMA) Period | Value $ | Signal | Exponential Moving Averages (EMA) Period | Value $ | Signal | |
|---|---|---|---|---|---|---|
| 2 | 268.57 | BUY | 2 | 268.70 | BUY | |
| 3 | 266.84 | BUY | 3 | 267.83 | BUY | |
| 5 | 265.70 | BUY | 5 | 267.35 | BUY | |
| 8 | 266.91 | BUY | 8 | 267.91 | BUY | |
| 13 | 269.73 | BUY | 13 | 268.89 | BUY | |
| 21 | 274.95 | SELL | 21 | 268.53 | BUY | |
| 34 | 266.90 | BUY | 34 | 265.97 | BUY | |
| 55 | 257.32 | BUY | 55 | 262.31 | BUY | |
| 90 | 255.79 | BUY | 90 | 258.81 | BUY | |
| 200 | 256.20 | BUY | 200 | 251.09 | BUY |
Fedex Corp
IPO: 1978-12-28
Ticker: FDXIndices: S&P 500,
Exchange: New York Stock Exchange, Inc. (US - USD)
Website: http://www.fedex.com/
Phone:
Common Stock
Energy & Transportation (
Air Courier Services

 Click to Enlarge