| Date | Price $ | Result % | Candle Name | Side |
|---|---|---|---|---|
| 001 10 Apr 2024 | Buy Price: 290.04 | Loss: Close Day2 ($ 287.87) | Piercing Line | Buy |
| 002 08 Apr 2024 | Sell Price: 293.13 | Profit: Open Day1 ($ 292.03) | Dark Cloud Cover | Sell |
| 003 27 Mar 2024 | Buy Price: 281.90 | Profit: Open Day1 ($ 282.60) | Abandoned Baby | Buy |
| 004 18 Mar 2024 | Buy Price: 277.60 | Profit: Open Day1 ($ 279.12) | Abandoned Baby | Buy |
| 005 26 Feb 2024 | Sell Price: 273.02 | Profit: Open Day1 ($ 272.33) | Dark Cloud Cover | Sell |
| 006 08 Feb 2024 | Sell Price: 269.00 | Loss: Close Day2 ($ 269.44) | Abandoned Baby | Sell |
| 007 07 Dec 2023 | Sell Price: 251.49 | Loss: Close Day2 ($ 252.42) | Dark Cloud Cover | Sell |
| 008 19 Sep 2023 | Sell Price: 222.85 | Profit: Close Day2 ($ 221.88) | Abandoned Baby | Sell |
| 009 12 Sep 2023 | Buy Price: 217.38 | Profit: Open Day1 ($ 218.01) | Engulfing | Buy |
| 010 12 Sep 2023 | Buy Price: 217.52 | Profit: Open Day1 ($ 218.01) | Piercing Line | Buy |
| 011 31 Aug 2023 | Sell Price: 226.64 | Profit: Close Day1 ($ 226.37) | Engulfing | Sell |
| 012 31 Aug 2023 | Sell Price: 226.79 | Profit: Close Day1 ($ 226.37) | Dark Cloud Cover | Sell |
| 013 24 Aug 2023 | Sell Price: 223.88 | Profit: Close Day1 ($ 223.59) | Abandoned Baby | Sell |
| 014 27 Jul 2023 | Sell Price: 219.82 | Loss: Close Day2 ($ 223.58) | Engulfing | Sell |
| 015 08 May 2023 | Sell Price: 210.71 | Loss: Close Day2 ($ 211.53) | Dark Cloud Cover | Sell |
| 016One Year Average | Both Sides Result for 15 Signals |
Loss: $ -1.04 ($ -0.07 / Signal) |
All of Them | Buy + Sell |
| Simple Moving Averages (SMA) Period | Value $ | Signal | Exponential Moving Averages (EMA) Period | Value $ | Signal | |
|---|---|---|---|---|---|---|
| 2 | 286.95 | BUY | 2 | 287.45 | BUY | |
| 3 | 286.12 | BUY | 3 | 286.93 | BUY | |
| 5 | 285.68 | BUY | 5 | 286.73 | BUY | |
| 8 | 286.73 | BUY | 8 | 286.94 | BUY | |
| 13 | 288.91 | SELL | 13 | 286.82 | BUY | |
| 21 | 286.77 | BUY | 21 | 285.55 | BUY | |
| 34 | 282.45 | BUY | 34 | 282.65 | BUY | |
| 55 | 277.73 | BUY | 55 | 277.77 | BUY | |
| 90 | 269.02 | BUY | 90 | 270.39 | BUY | |
| 200 | 247.63 | BUY | 200 | 255.11 | BUY |
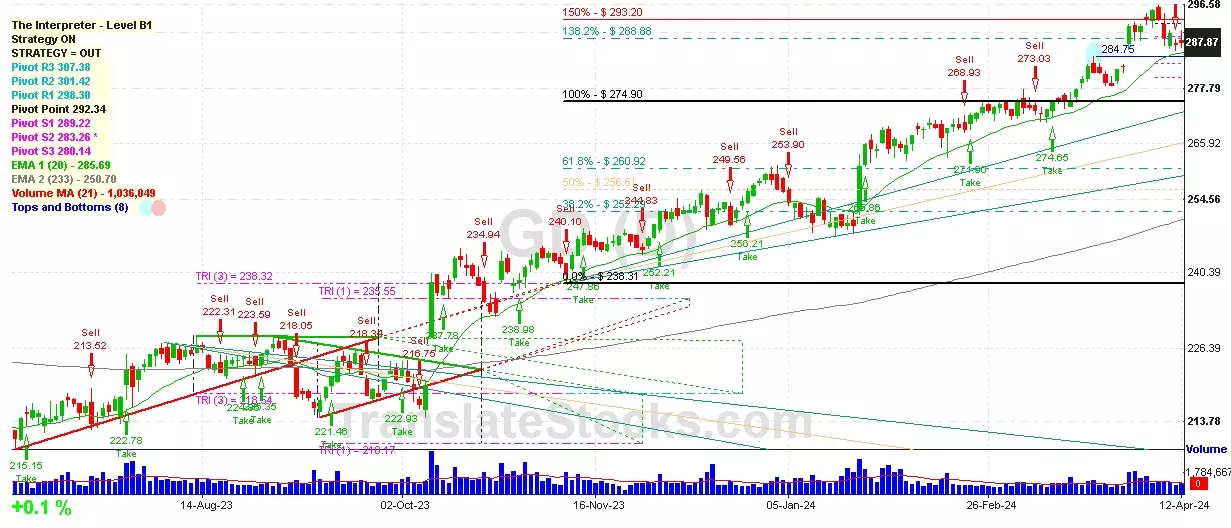
General Dynamics Corp
IPO: 1952-04-25
Ticker: GDIndices: S&P 500,
Exchange: New York Stock Exchange, Inc. (US - USD)
Website: https://www.gd.com
Phone:
Common Stock
Manufacturing (
Ship & Boat Building & Repairing

 Click to Enlarge