| Date | Price $ | Result % | Candle Name | Side |
|---|---|---|---|---|
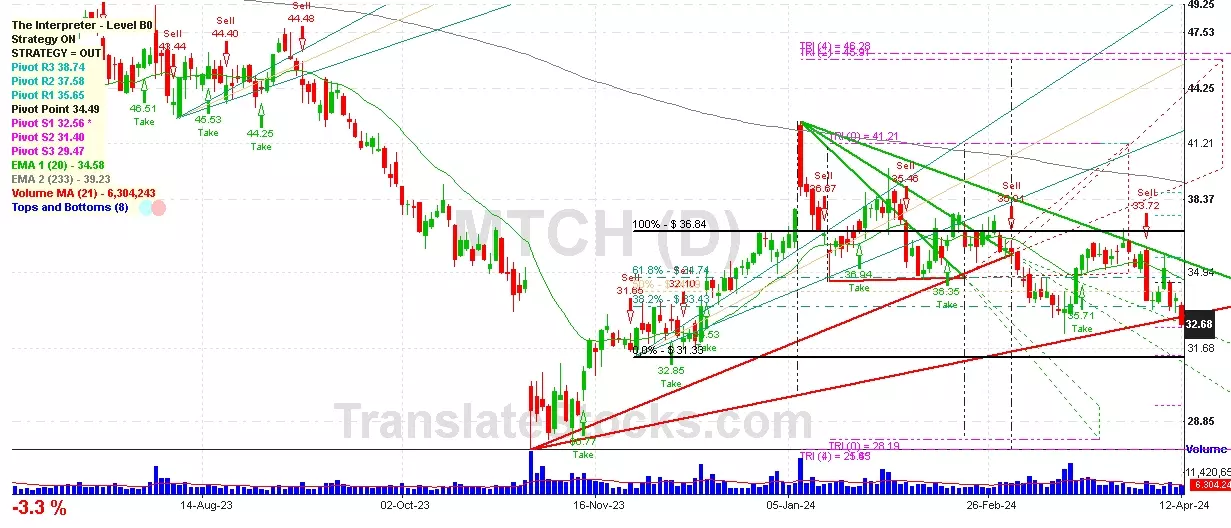
| 001 09 Jun 2023 | Buy Price: 122.23 | Profit: Open Day1 ($ 122.79) | Abandoned Baby | Buy |
| 002One Year Average | Both Sides Result for 1 Signals |
Profit: $ 0.55 ($ 0.55 / Signal) |
All of Them | Buy + Sell |
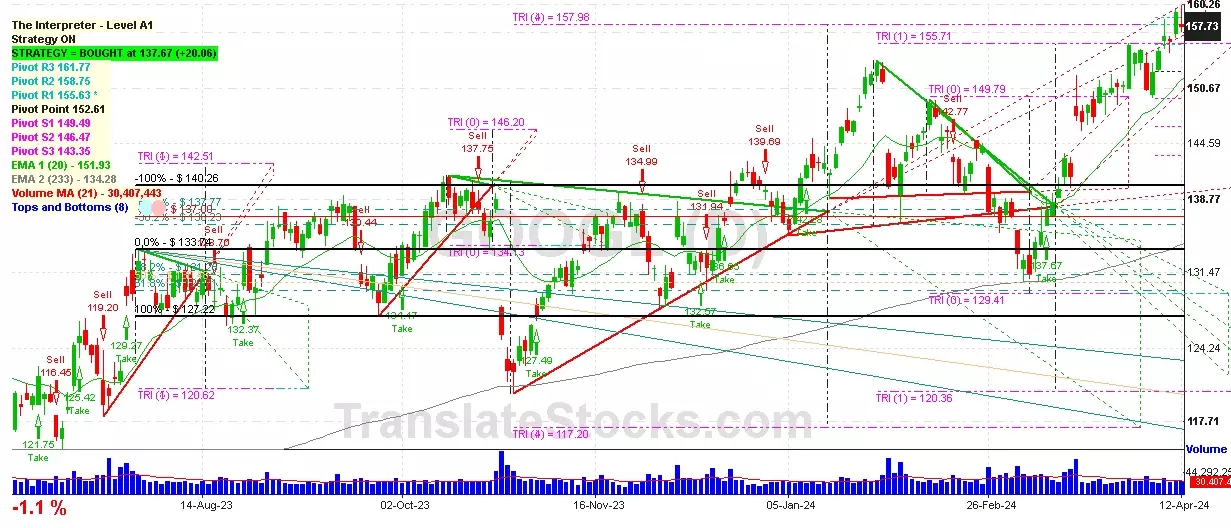
| Simple Moving Averages (SMA) Period | Value $ | Signal | Exponential Moving Averages (EMA) Period | Value $ | Signal | |
|---|---|---|---|---|---|---|
| 2 | 155.74 | BUY | 2 | 155.77 | BUY | |
| 3 | 155.29 | BUY | 3 | 155.70 | BUY | |
| 5 | 155.69 | BUY | 5 | 155.71 | BUY | |
| 8 | 156.33 | SELL | 8 | 155.51 | BUY | |
| 13 | 155.23 | BUY | 13 | 154.62 | BUY | |
| 21 | 153.48 | BUY | 21 | 152.80 | BUY | |
| 34 | 147.72 | BUY | 34 | 150.35 | BUY | |
| 55 | 145.80 | BUY | 55 | 147.68 | BUY | |
| 90 | 143.91 | BUY | 90 | 144.64 | BUY | |
| 200 | 136.97 | BUY | 200 | 165.09 | SELL |
Alphabet Inc-cl A
IPO: 2004-08-19
Ticker: GOOGLIndices: S&P 500,
Nasdaq 100,
Exchange: Nasdaq Nms - Global Market (US - USD)
Website: https://abc.xyz/
Phone:
Common Stock
Technology (
Services-computer Programming, Data Processing, Etc.
Year | 2021 | 2020 | 2019 | 2018 | 2017 | 2016 | 2015 | 2014 | 2013 | 2012 | |
|---|---|---|---|---|---|---|---|---|---|---|---|
| 1 | Assets + | 359,268 | 319,616 | 275,909 | 232,792 | 197,295 | 167,497 | 147,461 | 129,187 | 30,390 | 14,778 |
| 2 | Investments in and Advance to Affiliates + | 1,500 | 1,400 | 1,300 | 1,300 | 1,400 | 1,700 | 1,600 | 1,300 | 0 | 0 |
| 3 | Cash and Cash Equivalents + | 20,945 | 26,465 | 18,498 | 16,701 | 10,715 | 12,918 | 16,549 | 18,347 | 18,898 | 14,778 |
| 4 | Property + | 97,599 | 84,749 | 73,646 | 59,719 | 42,383 | 34,234 | 29,016 | 23,883 | 0 | 0 |
| 5 | Property + | 147,012 | 126,462 | 104,207 | 82,507 | 59,647 | 47,527 | 40,146 | 32,746 | 0 | 0 |
| 6 | Intangible Assets + | 1,417 | 1,445 | 1,979 | 2,220 | 2,692 | 3,307 | 3,847 | 4,607 | 0 | 0 |
| 7 | Finite-Lived Intangible Assets + | 1,279 | 1,445 | 1,979 | 2,220 | 2,692 | 3,307 | 3,847 | 4,607 | 0 | 0 |
| 8 | Liabilities and Equity + | 359,268 | 319,616 | 275,909 | 232,792 | 197,295 | 167,497 | 147,461 | 129,187 | 86,977 | 71,570 |
| 9 | Liabilities + | 107,633 | 97,072 | 74,467 | 55,164 | 44,793 | 28,461 | 27,130 | 18,779 | 0 | 0 |
| 10 | Debt and Lease Obligation + | 0 | 0 | 0 | 0 | 0 | 0 | 2,000 | 2,000 | 0 | 0 |
| 11 | Stockholders' Equity + | 251,635 | 222,544 | 201,442 | 177,628 | 152,502 | 139,036 | 120,331 | 103,860 | 86,977 | 71,570 |
| 12 | Stockholders' Equity Attributable to Parent + | 251,635 | 222,544 | 201,442 | 177,628 | 152,502 | 139,036 | 120,331 | 103,860 | 86,977 | 71,570 |
| 13 | Preferred Stock + | 0 | 0 | 0 | 0 | 0 | 0 | 0 | 0 | 0 | 0 |
| 14 | Common Stock + | 0 | 0 | 0 | 0 | 0 | 0 | 0 | 0 | 0 | 0 |
| 15 | Partners' Capital + | 191,484 | 163,401 | 152,122 | 134,885 | 113,247 | 105,131 | 89,223 | 75,066 | 0 | 0 |
| 16 | Partners' Capital + | 191,484 | 163,401 | 152,122 | 134,885 | 113,247 | 105,131 | 89,223 | 75,066 | 0 | 0 |
| 17 | Limited Liability Company (LLC) Members' Equity + | 189,861 | 164,034 | 150,890 | 132,579 | 112,255 | 102,729 | 87,349 | 75,093 | 0 | 0 |
| 18 | Limited Liability Company (LLC) Members' Equity + | 189,861 | 164,034 | 150,890 | 132,579 | 112,255 | 102,729 | 87,349 | 75,093 | 0 | 0 |
| 19 | Current Assets + | 188,143 | 174,296 | 152,578 | 135,676 | 124,308 | 105,408 | 90,114 | 78,656 | 0 | 0 |
| 20 | Cash + | 139,649 | 136,694 | 119,675 | 109,140 | 101,871 | 86,333 | 73,066 | 64,395 | 0 | 0 |
| 21 | Current Other Undisclosed Receivables | 0 | 0 | 0 | 0 | 0 | 0 | 0 | 4,878 | 0 | 0 |
| 22 | Current Receivables + | 39,304 | 30,930 | 25,326 | 20,838 | 18,336 | 14,137 | 11,556 | 14,261 | 0 | 0 |
| 23 | Inventory + | 1,170 | 728 | 999 | 1,107 | 749 | 268 | 491 | 0 | 0 | 0 |
| 24 | Long-Term Assets + | 42,560 | 38,423 | 123,331 | 97,116 | 72,987 | 62,089 | 57,347 | 50,531 | 11,492 | 0 |
| 25 | Long-term Investments and Receivables + | 29,549 | 20,703 | 13,078 | 13,859 | 7,813 | 5,878 | 5,183 | 3,079 | 0 | 0 |
| 26 | Current Liabilities + | 64,254 | 56,834 | 45,221 | 34,620 | 24,183 | 16,756 | 19,310 | 16,779 | 0 | 0 |
| 27 | Long-Term Other Undisclosed Liabilities | 535 | 481 | 358 | 396 | -12,472 | 202 | 0 | 0 | 0 | 0 |
| 28 | Long-Term Liabilities + | 43,379 | 40,238 | 29,246 | 20,544 | 20,610 | 11,705 | 7,480 | 7,686 | 0 | 0 |
| 29 | Current Other Assets + | 7,054 | 5,490 | 4,412 | 4,236 | 2,983 | 4,575 | 0 | 0 | 0 | 0 |
| 30 | Total Current Assets + | 188,143 | 174,296 | 152,578 | 135,676 | 124,308 | 105,408 | 90,114 | 78,656 | 0 | 0 |
| 31 | Operating Lease + | 12,959 | 12,211 | 10,941 | 0 | 0 | 0 | 0 | 0 | 0 | 0 |
| 32 | Goodwill + | 22,956 | 21,175 | 20,624 | 17,888 | 16,747 | 16,468 | 15,869 | 15,599 | 11,492 | 0 |
| 33 | Long-Term Other Assets + | 5,361 | 3,953 | 2,342 | 2,693 | 2,672 | 1,819 | 0 | 0 | 0 | 0 |
| 34 | Deferred Income Tax Assets + | 6,645 | 5,037 | 3,063 | 3,430 | 3,352 | 2,202 | 0 | 0 | 0 | 0 |
| 35 | Total Long-Term Assets + | 0 | 0 | 123,331 | 97,116 | 72,987 | 62,089 | 57,347 | 50,531 | 0 | 0 |
| 36 | Total Assets + | 359,268 | 319,616 | 275,909 | 232,792 | 197,295 | 167,497 | 147,461 | 129,187 | 0 | 0 |
| 37 | Total Liabilities + | 107,633 | 97,072 | 74,467 | 55,164 | 44,793 | 28,461 | 27,130 | 0 | 0 | 0 |
| 38 | Total Liabilities and Equity + | 359,268 | 319,616 | 275,909 | 232,792 | 197,295 | 167,497 | 147,461 | 129,187 | 0 | 0 |
Year | 2021 | 2020 | 2019 | 2018 | 2017 | 2016 | 2015 | 2014 | 2013 | |
|---|---|---|---|---|---|---|---|---|---|---|
| 1 | 257,637 | 182,527 | 161,857 | 136,819 | 110,855 | 90,272 | 74,989 | 66,001 | 55,519 | |
| 2 | -110,939 | -84,732 | -71,896 | -59,549 | -45,583 | -35,138 | -28,164 | -25,691 | -21,993 | |
| 3 | 31,562 | 27,573 | 26,018 | 21,419 | 16,625 | 13,948 | 12,282 | 9,832 | 7,137 | |
| 4 | 22,912 | 17,946 | 18,464 | 16,333 | 12,893 | 10,485 | 9,047 | 8,131 | 6,554 | |
| 5 | 13,510 | 11,052 | 9,551 | 8,126 | 6,872 | 6,985 | 6,136 | 5,851 | 4,432 | |
| 6 | 0 | 0 | 0 | 0 | 0 | 0 | 0 | 0 | -57 | |
| 7 | 78,714 | 41,224 | 34,231 | 26,321 | 26,146 | 23,716 | 19,360 | 16,496 | 15,403 | |
| 8 | 149 | 176 | 455 | -138 | -169 | 0 | 0 | 0 | 0 | |
| 9 | 241 | -726 | 0 | 0 | 0 | 0 | 0 | 0 | 0 | |
| 10 | -240 | -344 | 103 | -80 | -121 | -475 | -422 | -402 | -379 | |
| 11 | 411 | -637 | 102 | 378 | 159 | 88 | 152 | 130 | 81 | |
| 12 | 12,020 | 6,858 | 5,394 | 8,592 | 1,047 | 434 | 291 | 763 | 496 | |
| 13 | 346 | 135 | 100 | 114 | 109 | 124 | 104 | 101 | 81 | |
| 14 | 0 | 48,082 | 39,625 | 34,913 | 27,193 | 24,150 | 19,651 | 17,259 | 15,899 | |
| 15 | 0 | 0 | 0 | 0 | -156 | -202 | -227 | -48 | 0 | |
| 16 | 90,734 | 48,082 | 39,625 | 34,913 | 27,193 | 0 | 0 | 0 | 0 | |
| 17 | -14,701 | -7,813 | -5,282 | -4,177 | -14,531 | -4,672 | -3,303 | -3,639 | -2,739 | |
| 18 | 0 | 0 | 0 | 0 | 0 | 0 | 0 | 516 | -427 | |
| 19 | Total Net Income (Loss) Attributable to Parent + | 76,033 | 40,269 | 34,343 | 30,736 | 12,662 | 19,478 | 16,348 | 14,136 | 12,733 |
| 20 | Total Preferred Stock Dividends and Other Adjustments + | 0 | 0 | 0 | 0 | 0 | 0 | -522 | 0 | 0 |
| 21 | 0 | 0 | 0 | 0 | 12,662 | 19,478 | 15,826 | 14,136 | 12,733 | |
| 22 | Total Income (Loss) from Continuing Operations + | 0 | 0 | 0 | 0 | 0 | 19,478 | 16,348 | 13,620 | 13,160 |
| 23 | Income (Loss) from Discontinued Operations + | 0 | 0 | 0 | 0 | 0 | 0 | 0 | 516 | -427 |
| 24 | Income (Loss) from Continuing Operations + | 0 | 0 | 0 | 0 | 0 | 0 | 0 | 20.15 | 19.77 |
| 25 | Total Earnings Per Share + | 113.88 | 59.15 | 49.59 | 44.22 | 18.27 | 28.32 | 0 | 20.91 | 19.13 |
| 26 | Income (Loss) from Continuing Operations + | 0 | 0 | 0 | 0 | 0 | 0 | 0 | 20.15 | 19.77 |
| 27 | Income (Loss) from Continuing Operations + | 0 | 0 | 0 | 0 | 0 | 0 | 0 | 19.82 | 19.42 |
| 28 | Total Earnings Per Share + | 112.20 | 58.61 | 49.16 | 43.70 | 18 | 27.85 | 0 | 20.57 | 18.79 |
 Click to Enlarge