
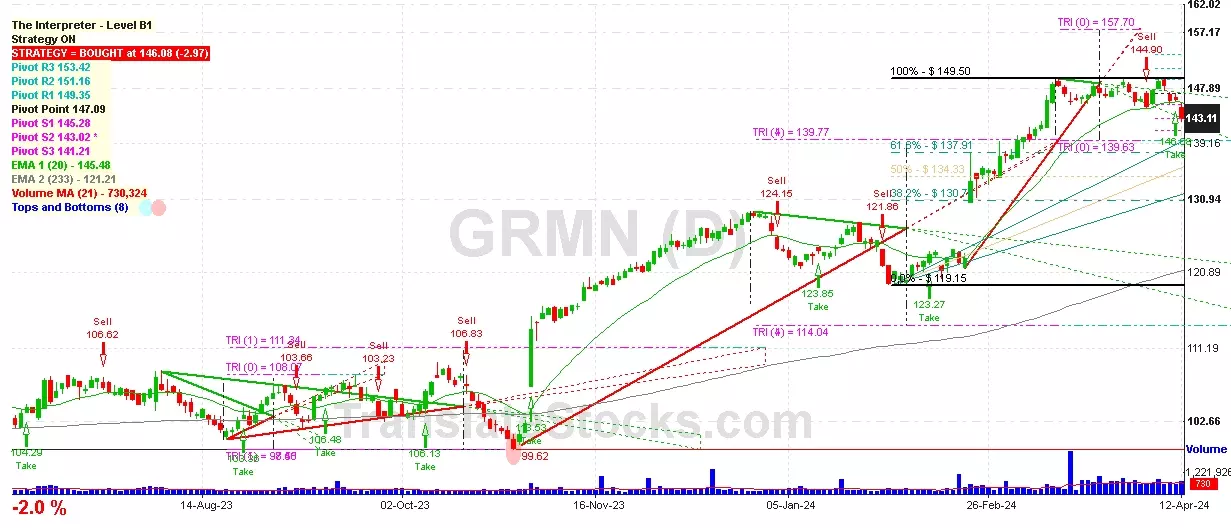
Hey Friend, I'm analysing GARMIN LTD (GRMN), and it is between the Support of $ 143.02 (PivotS2) and the Resistance of $ 145.28 (PivotS1). The stock is also approaching the line of PivotS2 at $ 143.02, and if it goes below this line it could reach the next Support of Triangle projection at $139.77.

| Date | Price $ | Result % | Candle Name | Side |
|---|---|---|---|---|
| 001 26 Mar 2024 | Buy Price: 147.66 | Profit: Open Day1 ($ 147.96) | Abandoned Baby | Buy |
| 002 26 Mar 2024 | Buy Price: 147.40 | Profit: Open Day1 ($ 147.96) | Engulfing | Buy |
| 003 18 Mar 2024 | Buy Price: 146.01 | Profit: Open Day1 ($ 146.30) | Abandoned Baby | Buy |
| 004 20 Feb 2024 | Buy Price: 122.75 | Profit: Open Day1 ($ 129.99) | Piercing Line | Buy |
| 005 16 Jan 2024 | Sell Price: 123.59 | Profit: Open Day1 ($ 122.98) | Abandoned Baby | Sell |
| 006 18 Jul 2023 | Buy Price: 107.45 | Profit: Close Day1 ($ 107.68) | Abandoned Baby | Buy |
| 007 03 Jul 2023 | Sell Price: 103.75 | Profit: Open Day1 ($ 103.18) | Engulfing | Sell |
| 008 03 May 2023 | Buy Price: 100.08 | Profit: Open Day1 ($ 100.24) | Engulfing | Buy |
| 009One Year Average | Both Sides Result for 8 Signals |
Profit: $ 9.97 ($ 1.25 / Signal) |
All of Them | Buy + Sell |
| Simple Moving Averages (SMA) Period | Value $ | Signal | Exponential Moving Averages (EMA) Period | Value $ | Signal | |
|---|---|---|---|---|---|---|
| 2 | 142.65 | BUY | 2 | 142.50 | BUY | |
| 3 | 142.11 | BUY | 3 | 142.20 | BUY | |
| 5 | 141.31 | BUY | 5 | 142.00 | BUY | |
| 8 | 141.43 | BUY | 8 | 142.25 | BUY | |
| 13 | 143.38 | SELL | 13 | 142.90 | SELL | |
| 21 | 144.75 | SELL | 21 | 143.29 | SELL | |
| 34 | 145.30 | SELL | 34 | 142.37 | BUY | |
| 55 | 139.46 | BUY | 55 | 139.58 | BUY | |
| 90 | 133.75 | BUY | 90 | 134.81 | BUY | |
| 200 | 120.19 | BUY | 200 | 124.33 | BUY |
Garmin Ltd
IPO: 2000-12-08
Ticker: GRMNIndices: S&P 500,
Exchange: Nasdaq Nms - Global Market (CH - USD)
Website: http://www.garmin.com/
Phone:
Common Stock
Manufacturing (
Search, Detection, Navagation, Guidance, Aeronautical Sys
 Click to Enlarge