| Date | Price $ | Result % | Candle Name | Side |
|---|---|---|---|---|
| 001 27 Dec 2023 | Sell Price: 36.66 | Profit: Open Day1 ($ 36.45) | Abandoned Baby | Sell |
| 002 09 Nov 2023 | Buy Price: 37.80 | Profit: Open Day1 ($ 38.24) | Abandoned Baby | Buy |
| 003 13 Jul 2023 | Sell Price: 37.75 | Profit: Open Day1 ($ 37.18) | Engulfing | Sell |
| 004 30 Jun 2023 | Sell Price: 32.99 | Loss: Close Day2 ($ 33.20) | Dark Cloud Cover | Sell |
| 005One Year Average | Both Sides Result for 4 Signals |
Profit: $ 1.01 ($ 0.25 / Signal) |
All of Them | Buy + Sell |
| Simple Moving Averages (SMA) Period | Value $ | Signal | Exponential Moving Averages (EMA) Period | Value $ | Signal | |
|---|---|---|---|---|---|---|
| 2 | 38.66 | BUY | 2 | 38.70 | BUY | |
| 3 | 38.68 | BUY | 3 | 38.70 | BUY | |
| 5 | 38.75 | SELL | 5 | 38.76 | SELL | |
| 8 | 38.67 | BUY | 8 | 38.92 | SELL | |
| 13 | 39.46 | SELL | 13 | 39.09 | SELL | |
| 21 | 39.63 | SELL | 21 | 39.03 | SELL | |
| 34 | 38.82 | SELL | 34 | 38.62 | BUY | |
| 55 | 37.35 | BUY | 55 | 38.05 | BUY | |
| 90 | 36.68 | BUY | 90 | 37.63 | BUY | |
| 200 | 38.10 | BUY | 200 | 37.08 | BUY |
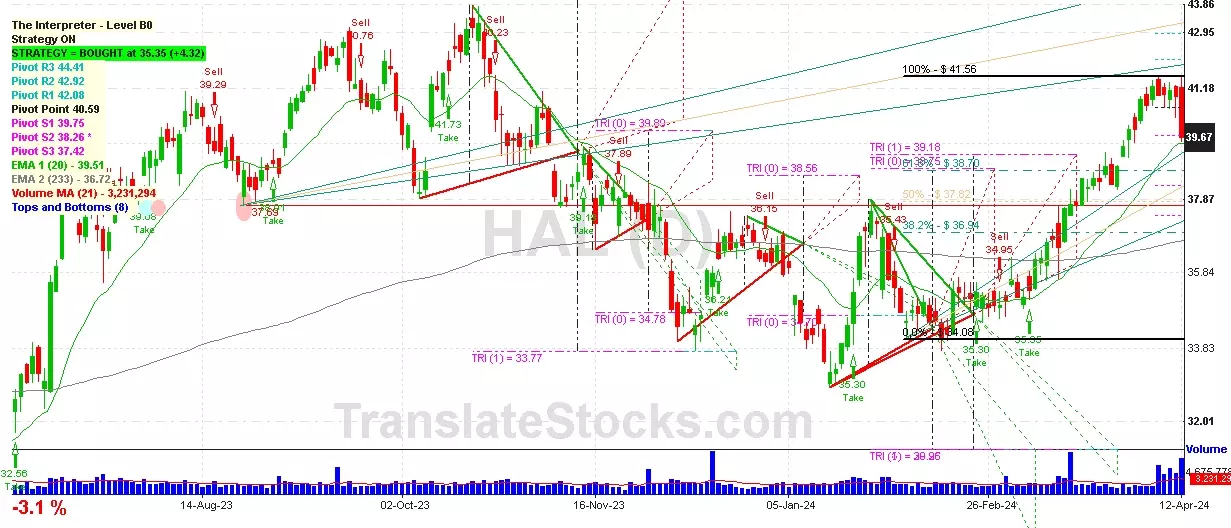
Halliburton Co
IPO: 1948-09-15
Ticker: HALIndices: S&P 500,
Exchange: New York Stock Exchange, Inc. (US - USD)
Website: https://www.halliburton.com/en-US/default.html
Phone:
Common Stock
Energy & Transportation (
Oil & Gas Field Services, Nec

 Click to Enlarge