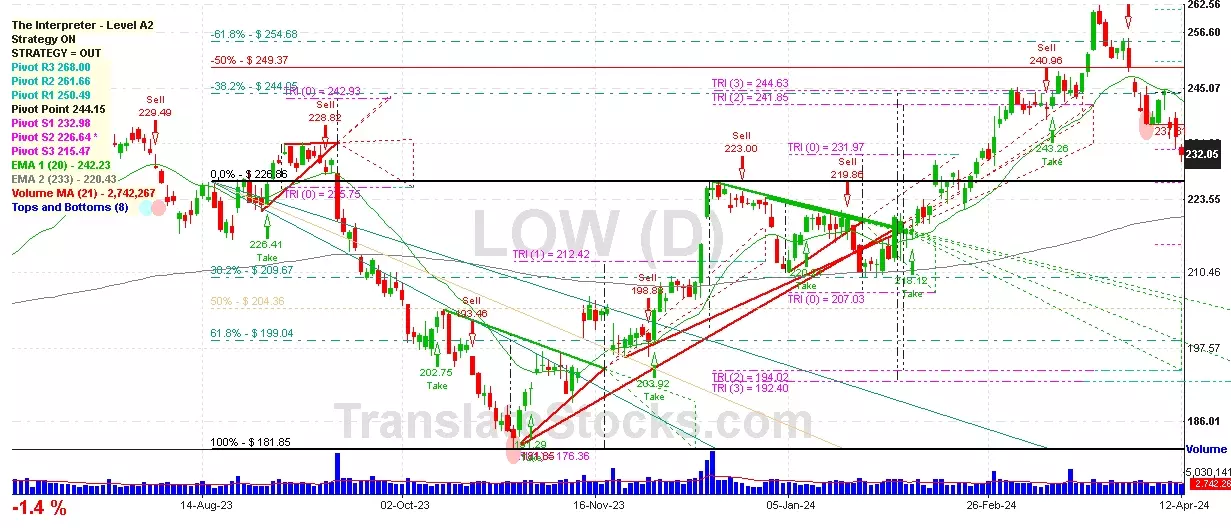
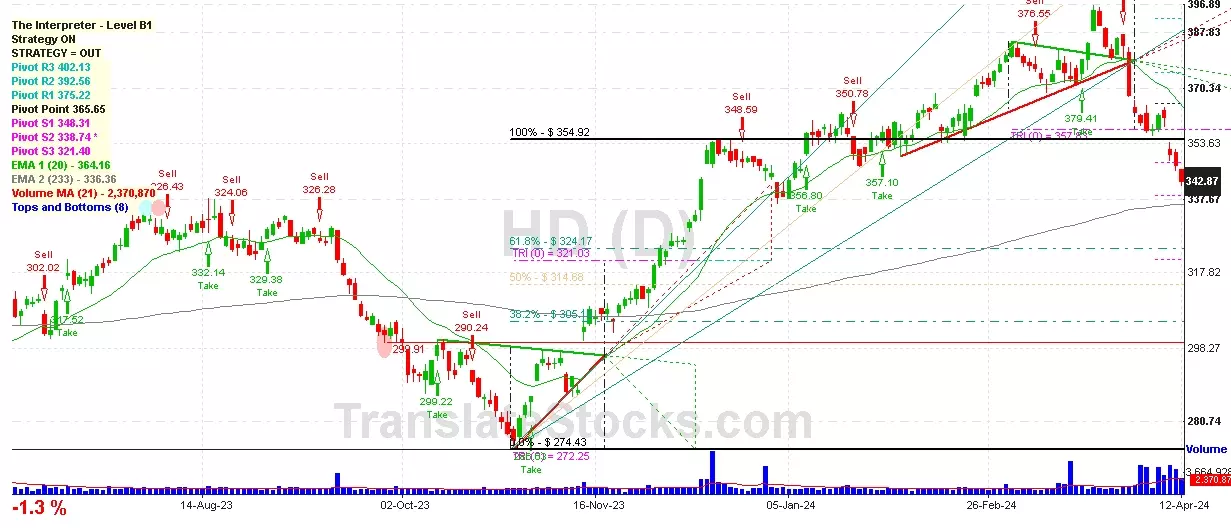
Hey Friend, I'm analysing HOME DEPOT INC (HD), and it is between the Support of $ 338.74 (PivotS2) and the Resistance of $ 348.31 (PivotS1). The stock is also approaching the line of PivotS2 at $ 338.74, and if it goes below this line it could reach the next Support of 61.8% of Fibonacci at $ 324.17.

| Date | Price $ | Result % | Candle Name | Side |
|---|---|---|---|---|
| 001 12 Mar 2024 | Buy Price: 374.54 | Profit: Open Day1 ($ 376.03) | Abandoned Baby | Buy |
| 002 14 Feb 2024 | Buy Price: 358.23 | Profit: Open Day1 ($ 358.90) | Piercing Line | Buy |
| 003 09 Feb 2024 | Sell Price: 363.15 | Profit: Open Day2 ($ 358.47) | Dark Cloud Cover | Sell |
| 004 26 Dec 2023 | Buy Price: 349.31 | Profit: Open Day1 ($ 349.91) | Engulfing | Buy |
| 005 14 Nov 2023 | Buy Price: 303.63 | Profit: Open Day1 ($ 304.10) | Abandoned Baby | Buy |
| 006 16 Oct 2023 | Buy Price: 297.33 | Loss: Close Day2 ($ 290.24) | Abandoned Baby | Buy |
| 007 06 Oct 2023 | Buy Price: 292.82 | Profit: Close Day1 ($ 295.36) | Engulfing | Buy |
| 008 14 Sep 2023 | Buy Price: 329.63 | Loss: Close Day2 ($ 317.26) | Abandoned Baby | Buy |
| 009 05 Sep 2023 | Sell Price: 327.78 | Profit: Open Day1 ($ 327.53) | Abandoned Baby | Sell |
| 010 26 Jun 2023 | Buy Price: 307.89 | Profit: Open Day1 ($ 308.15) | Abandoned Baby | Buy |
| 011 24 May 2023 | Sell Price: 291.10 | Profit: Close Day1 ($ 286.75) | Dark Cloud Cover | Sell |
| 012 23 May 2023 | Buy Price: 294.94 | Profit: Open Day1 ($ 297.37) | Engulfing | Buy |
| 013One Year Average | Both Sides Result for 12 Signals |
Loss: $ -1.72 ($ -0.14 / Signal) |
All of Them | Buy + Sell |
| Simple Moving Averages (SMA) Period | Value $ | Signal | Exponential Moving Averages (EMA) Period | Value $ | Signal | |
|---|---|---|---|---|---|---|
| 2 | 335.74 | BUY | 2 | 335.63 | BUY | |
| 3 | 334.79 | BUY | 3 | 335.48 | BUY | |
| 5 | 334.40 | BUY | 5 | 336.42 | SELL | |
| 8 | 337.52 | SELL | 8 | 339.39 | SELL | |
| 13 | 345.37 | SELL | 13 | 344.93 | SELL | |
| 21 | 357.33 | SELL | 21 | 351.64 | SELL | |
| 34 | 365.12 | SELL | 34 | 357.03 | SELL | |
| 55 | 365.77 | SELL | 55 | 358.24 | SELL | |
| 90 | 359.89 | SELL | 90 | 353.81 | SELL | |
| 200 | 333.58 | BUY | 200 | 338.96 | SELL |
Common Stock
Trade & Services (
Retail-lumber & Other Building Materials Dealers
 Click to Enlarge