| Date | Price $ | Result % | Candle Name | Side |
|---|---|---|---|---|
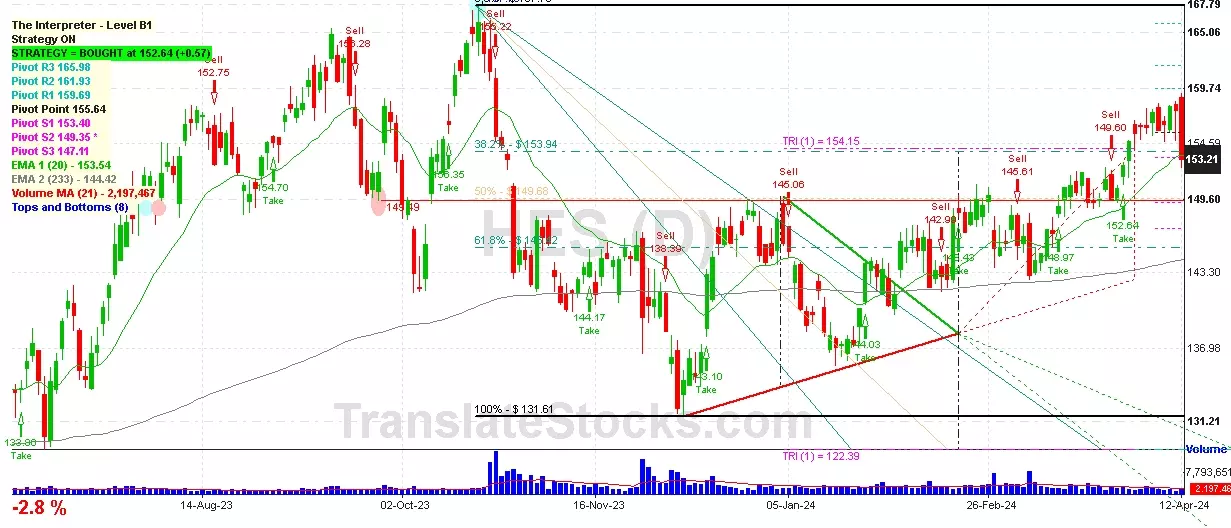
| 001 04 Mar 2024 | Sell Price: 145.61 | Profit: Close Day2 ($ 143.02) | Engulfing | Sell |
| 002 08 Feb 2024 | Buy Price: 146.27 | Loss: Close Day2 ($ 143.51) | Engulfing | Buy |
| 003 07 Feb 2024 | Sell Price: 145.20 | Profit: Open Day1 ($ 145.16) | Engulfing | Sell |
| 004 27 Nov 2023 | Sell Price: 144.51 | Profit: Open Day1 ($ 144.32) | Abandoned Baby | Sell |
| 005 07 Aug 2023 | Sell Price: 151.84 | Profit: Open Day1 ($ 149.26) | Abandoned Baby | Sell |
| 006 03 Aug 2023 | Buy Price: 151.94 | Profit: Open Day1 ($ 152.57) | Abandoned Baby | Buy |
| 007 03 Aug 2023 | Buy Price: 152.09 | Profit: Open Day1 ($ 152.57) | Engulfing | Buy |
| 008 26 Apr 2023 | Buy Price: 142.95 | Profit: Close Day2 ($ 145.06) | Piercing Line | Buy |
| 009One Year Average | Both Sides Result for 8 Signals |
Profit: $ 5.86 ($ 0.73 / Signal) |
All of Them | Buy + Sell |
| Simple Moving Averages (SMA) Period | Value $ | Signal | Exponential Moving Averages (EMA) Period | Value $ | Signal | |
|---|---|---|---|---|---|---|
| 2 | 153.07 | BUY | 2 | 153.39 | BUY | |
| 3 | 152.31 | BUY | 3 | 152.95 | BUY | |
| 5 | 151.76 | BUY | 5 | 152.85 | BUY | |
| 8 | 153.46 | BUY | 8 | 153.13 | BUY | |
| 13 | 154.58 | SELL | 13 | 153.28 | BUY | |
| 21 | 153.47 | BUY | 21 | 152.82 | BUY | |
| 34 | 151.26 | BUY | 34 | 151.64 | BUY | |
| 55 | 149.26 | BUY | 55 | 150.06 | BUY | |
| 90 | 146.57 | BUY | 90 | 148.62 | BUY | |
| 200 | 148.14 | BUY | 200 | 145.88 | BUY |
Hess Corp
IPO: 1926-03-15
Ticker: HESIndices: S&P 500,
Exchange: New York Stock Exchange, Inc. (US - USD)
Website: https://www.hess.com/
Phone:
Common Stock
Energy & Transportation (
Petroleum Refining

 Click to Enlarge