| Date | Price $ | Result % | Candle Name | Side |
|---|---|---|---|---|
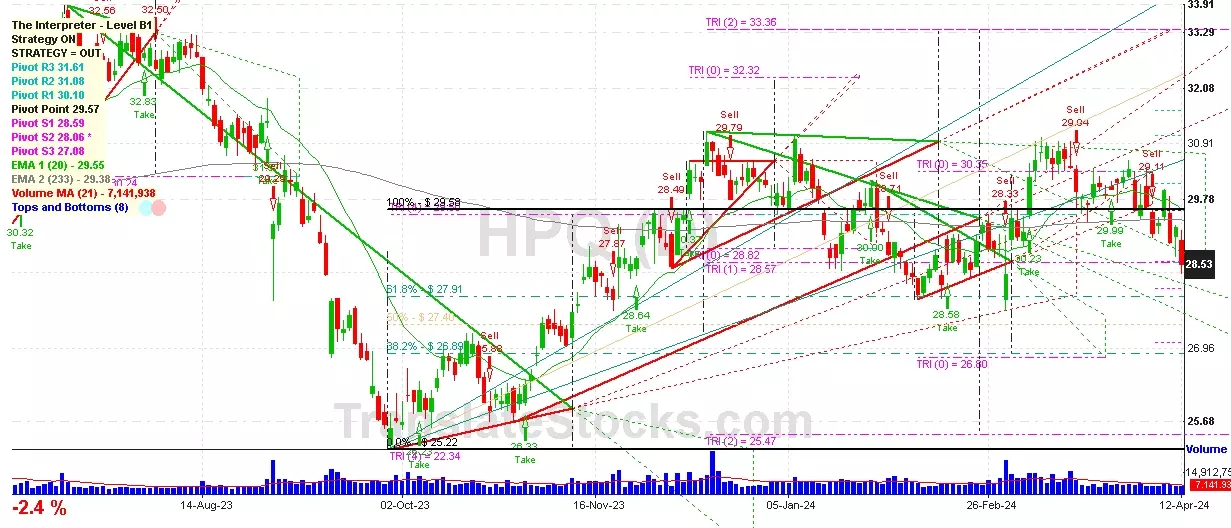
| 001 02 Apr 2024 | Sell Price: 29.56 | Profit: Open Day1 ($ 29.47) | Abandoned Baby | Sell |
| 002 30 Aug 2023 | Sell Price: 29.29 | Loss: Close Day2 ($ 30.37) | Abandoned Baby | Sell |
| 003 12 Jul 2023 | Sell Price: 32.90 | Profit: Close Day2 ($ 32.79) | Dark Cloud Cover | Sell |
| 004 16 Jun 2023 | Sell Price: 31.00 | Profit: Open Day1 ($ 30.81) | Dark Cloud Cover | Sell |
| 005 09 Jun 2023 | Sell Price: 29.80 | Loss: Close Day2 ($ 30.89) | Engulfing | Sell |
| 006 30 May 2023 | Sell Price: 30.93 | Profit: Open Day1 ($ 29.77) | Engulfing | Sell |
| 007One Year Average | Both Sides Result for 6 Signals |
Loss: $ -0.62 ($ -0.10 / Signal) |
All of Them | Buy + Sell |
| Simple Moving Averages (SMA) Period | Value $ | Signal | Exponential Moving Averages (EMA) Period | Value $ | Signal | |
|---|---|---|---|---|---|---|
| 2 | 27.74 | SELL | 2 | 27.77 | SELL | |
| 3 | 27.81 | SELL | 3 | 27.90 | SELL | |
| 5 | 28.24 | SELL | 5 | 28.16 | SELL | |
| 8 | 28.68 | SELL | 8 | 28.48 | SELL | |
| 13 | 29.06 | SELL | 13 | 28.83 | SELL | |
| 21 | 29.41 | SELL | 21 | 29.12 | SELL | |
| 34 | 29.65 | SELL | 34 | 29.29 | SELL | |
| 55 | 29.26 | SELL | 55 | 29.32 | SELL | |
| 90 | 29.51 | SELL | 90 | 29.27 | SELL | |
| 200 | 29.35 | SELL | 200 | 29.30 | SELL |
Hp Inc
IPO: 1961-03-17
Ticker: HPQIndices: S&P 500,
Exchange: New York Stock Exchange, Inc. (US - USD)
Website: https://investor.hp.com/
Phone:
Common Stock
Technology (
Computer & Office Equipment

 Click to Enlarge