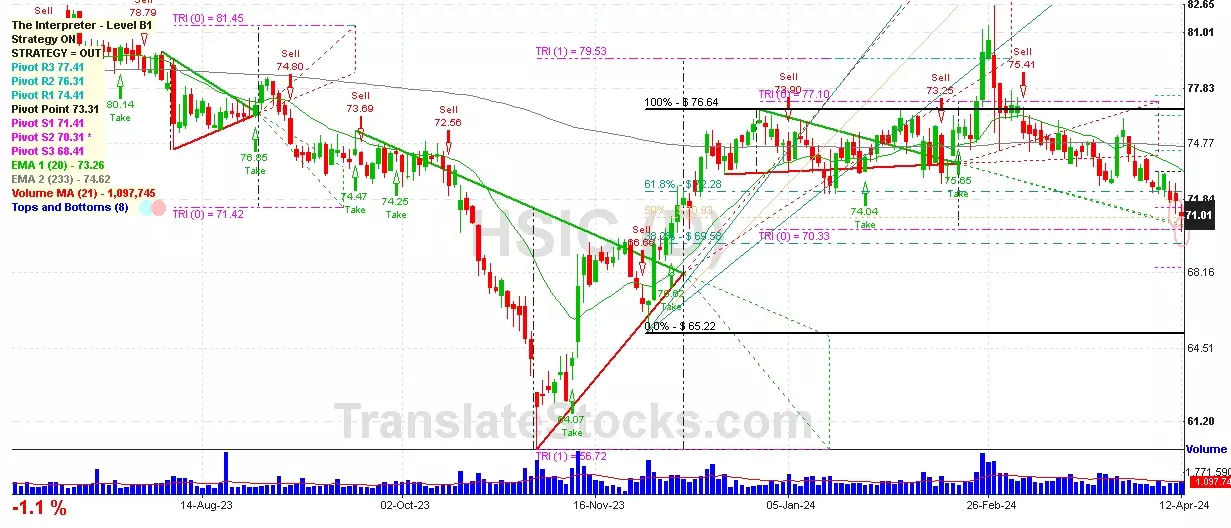
| Date | Price $ | Result % | Candle Name | Side |
|---|---|---|---|---|
| 001 21 Mar 2024 | Sell Price: 74.08 | Profit: Open Day1 ($ 73.96) | Engulfing | Sell |
| 002 07 Feb 2024 | Sell Price: 75.26 | Profit: Open Day1 ($ 73.43) | Engulfing | Sell |
| 003 04 Oct 2023 | Buy Price: 74.16 | Profit: Close Day2 ($ 74.36) | Abandoned Baby | Buy |
| 004 27 Sep 2023 | Sell Price: 73.26 | Loss: Close Day2 ($ 74.25) | Engulfing | Sell |
| 005 20 Sep 2023 | Buy Price: 74.47 | Loss: Close Day2 ($ 73.11) | Abandoned Baby | Buy |
| 006 25 Aug 2023 | Buy Price: 76.85 | Profit: Open Day1 ($ 77.05) | Abandoned Baby | Buy |
| 007 25 Jul 2023 | Buy Price: 80.14 | Loss: Close Day2 ($ 79.45) | Engulfing | Buy |
| 008 23 Jun 2023 | Sell Price: 78.90 | Loss: Close Day2 ($ 80.13) | Abandoned Baby | Sell |
| 009One Year Average | Both Sides Result for 8 Signals |
Loss: $ -1.92 ($ -0.24 / Signal) |
All of Them | Buy + Sell |
| Simple Moving Averages (SMA) Period | Value $ | Signal | Exponential Moving Averages (EMA) Period | Value $ | Signal | |
|---|---|---|---|---|---|---|
| 2 | 72.99 | BUY | 2 | 72.93 | BUY | |
| 3 | 72.67 | BUY | 3 | 72.62 | BUY | |
| 5 | 71.77 | BUY | 5 | 72.20 | BUY | |
| 8 | 71.37 | BUY | 8 | 71.96 | BUY | |
| 13 | 71.64 | BUY | 13 | 72.01 | BUY | |
| 21 | 72.43 | BUY | 21 | 72.38 | BUY | |
| 34 | 73.18 | BUY | 34 | 72.94 | BUY | |
| 55 | 74.28 | SELL | 55 | 73.36 | SELL | |
| 90 | 74.41 | SELL | 90 | 73.54 | SELL | |
| 200 | 73.69 | SELL | 200 | 74.18 | SELL |
Henry Schein Inc
IPO: 1995-11-03
Ticker: HSICIndices: S&P 500,
Exchange: Nasdaq Nms - Global Market (US - USD)
Website: https://www.henryschein.com/
Phone:
Common Stock
Trade & Services (
Wholesale-medical, Dental & Hospital Equipment & Supplies

 Click to Enlarge