| Date | Price $ | Result % | Candle Name | Side |
|---|---|---|---|---|
| 001 26 Mar 2024 | Buy Price: 530.60 | Profit: Open Day1 ($ 537.78) | Engulfing | Buy |
| 002 26 Mar 2024 | Buy Price: 530.74 | Profit: Open Day1 ($ 537.78) | Piercing Line | Buy |
| 003 04 Mar 2024 | Sell Price: 571.28 | Profit: Close Day1 ($ 558.32) | Engulfing | Sell |
| 004 27 Nov 2023 | Buy Price: 479.63 | Loss: Close Day2 ($ 466.74) | Piercing Line | Buy |
| 005 20 Nov 2023 | Buy Price: 472.93 | Profit: Open Day1 ($ 474.58) | Engulfing | Buy |
| 006 11 Oct 2023 | Sell Price: 445.88 | Profit: Close Day1 ($ 428.31) | Engulfing | Sell |
| 007 11 Oct 2023 | Sell Price: 445.51 | Profit: Close Day1 ($ 428.31) | Dark Cloud Cover | Sell |
| 008 20 Jun 2023 | Sell Price: 482.22 | Loss: Close Day2 ($ 490.72) | Abandoned Baby | Sell |
| 009 01 Jun 2023 | Buy Price: 469.84 | Profit: Open Day1 ($ 471.86) | Engulfing | Buy |
| 010 17 May 2023 | Sell Price: 487.12 | Profit: Open Day1 ($ 486.01) | Engulfing | Sell |
| 011One Year Average | Both Sides Result for 10 Signals |
Profit: $ 45.34 ($ 4.53 / Signal) |
All of Them | Buy + Sell |
| Simple Moving Averages (SMA) Period | Value $ | Signal | Exponential Moving Averages (EMA) Period | Value $ | Signal | |
|---|---|---|---|---|---|---|
| 2 | 494.54 | SELL | 2 | 494.26 | SELL | |
| 3 | 497.39 | SELL | 3 | 496.91 | SELL | |
| 5 | 503.23 | SELL | 5 | 501.45 | SELL | |
| 8 | 508.56 | SELL | 8 | 506.79 | SELL | |
| 13 | 517.39 | SELL | 13 | 513.44 | SELL | |
| 21 | 522.51 | SELL | 21 | 521.17 | SELL | |
| 34 | 536.89 | SELL | 34 | 528.58 | SELL | |
| 55 | 543.43 | SELL | 55 | 531.71 | SELL | |
| 90 | 541.88 | SELL | 90 | 527.50 | SELL | |
| 200 | 504.86 | SELL | 200 | 509.17 | SELL |
Idexx Laboratories Inc
IPO: 1991-06-21
Ticker: IDXXIndices: S&P 500,
Nasdaq 100,
Exchange: Nasdaq Nms - Global Market (US - USD)
Website: https://www.idexx.com/
Phone:
Common Stock
Life Sciences (
In Vitro & In Vivo Diagnostic Substances

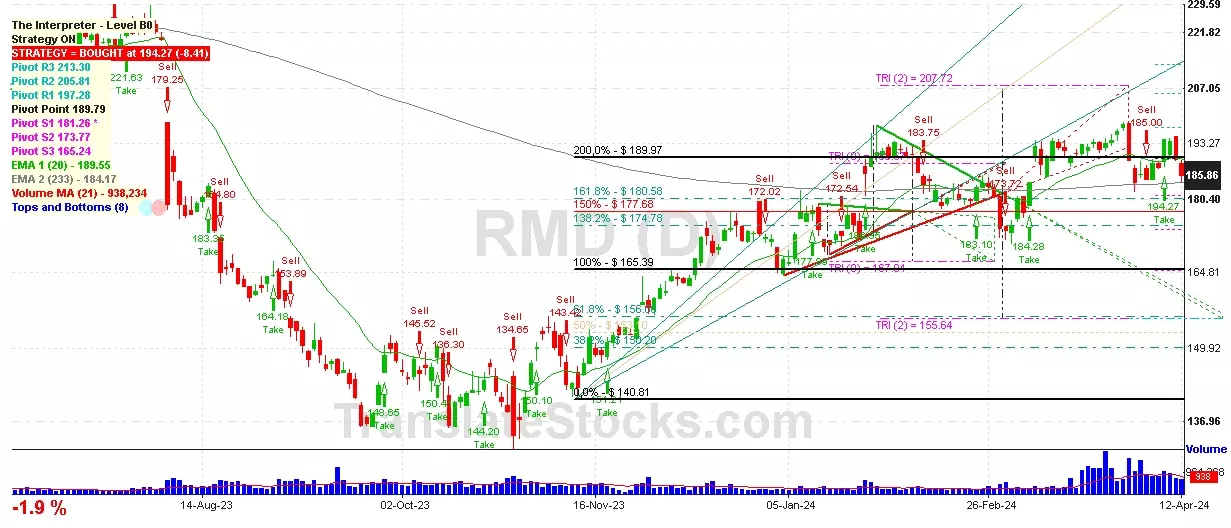
 Click to Enlarge
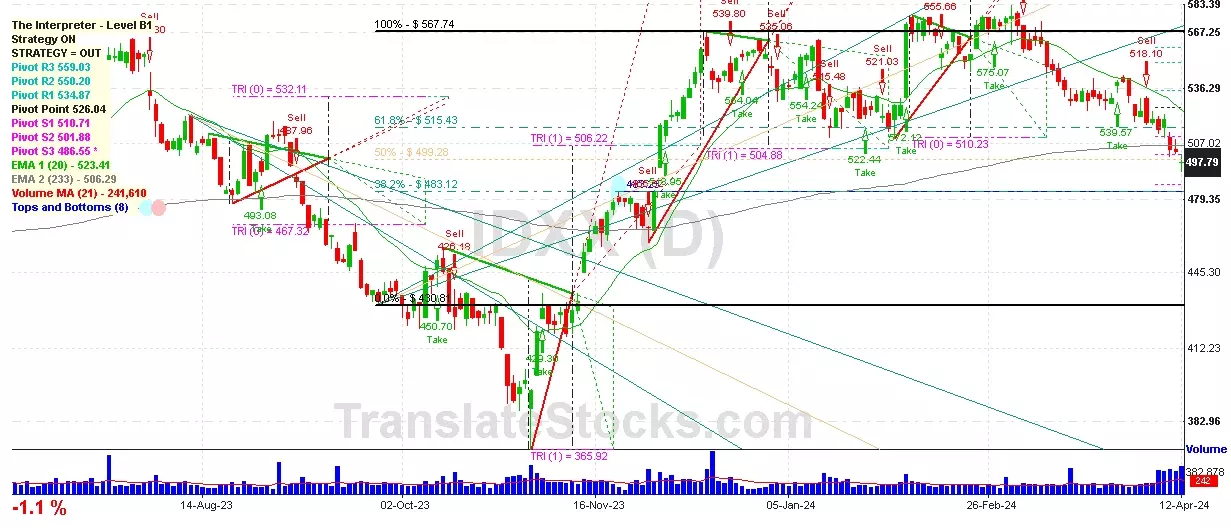