| Date | Price $ | Result % | Candle Name | Side |
|---|---|---|---|---|
| 001 10 Apr 2024 | Sell Price: 131.17 | Profit: Close Day1 ($ 130.70) | Abandoned Baby | Sell |
| 002 29 Feb 2024 | Sell Price: 139.83 | Profit: Open Day1 ($ 139.20) | Dark Cloud Cover | Sell |
| 003 06 Feb 2024 | Buy Price: 144.89 | Profit: Open Day1 ($ 145.09) | Engulfing | Buy |
| 004 05 Sep 2023 | Sell Price: 159.43 | Profit: Close Day2 ($ 158.85) | Abandoned Baby | Sell |
| 005 02 Aug 2023 | Buy Price: 189.56 | Loss: Close Day2 ($ 187.67) | Piercing Line | Buy |
| 006 16 Jun 2023 | Sell Price: 205.87 | Profit: Open Day1 ($ 201.78) | Dark Cloud Cover | Sell |
| 007 13 Jun 2023 | Sell Price: 206.84 | Profit: Close Day1 ($ 204.84) | Engulfing | Sell |
| 008One Year Average | Both Sides Result for 7 Signals |
Profit: $ 6.08 ($ 0.87 / Signal) |
All of Them | Buy + Sell |
| Simple Moving Averages (SMA) Period | Value $ | Signal | Exponential Moving Averages (EMA) Period | Value $ | Signal | |
|---|---|---|---|---|---|---|
| 2 | 123.67 | SELL | 2 | 122.83 | BUY | |
| 3 | 122.53 | BUY | 3 | 122.31 | BUY | |
| 5 | 120.34 | BUY | 5 | 121.77 | BUY | |
| 8 | 119.86 | BUY | 8 | 122.07 | BUY | |
| 13 | 123.96 | SELL | 13 | 123.46 | SELL | |
| 21 | 126.86 | SELL | 21 | 125.64 | SELL | |
| 34 | 129.44 | SELL | 34 | 128.17 | SELL | |
| 55 | 133.17 | SELL | 55 | 130.22 | SELL | |
| 90 | 135.20 | SELL | 90 | 132.30 | SELL | |
| 200 | 139.27 | SELL | 200 | 144.94 | SELL |
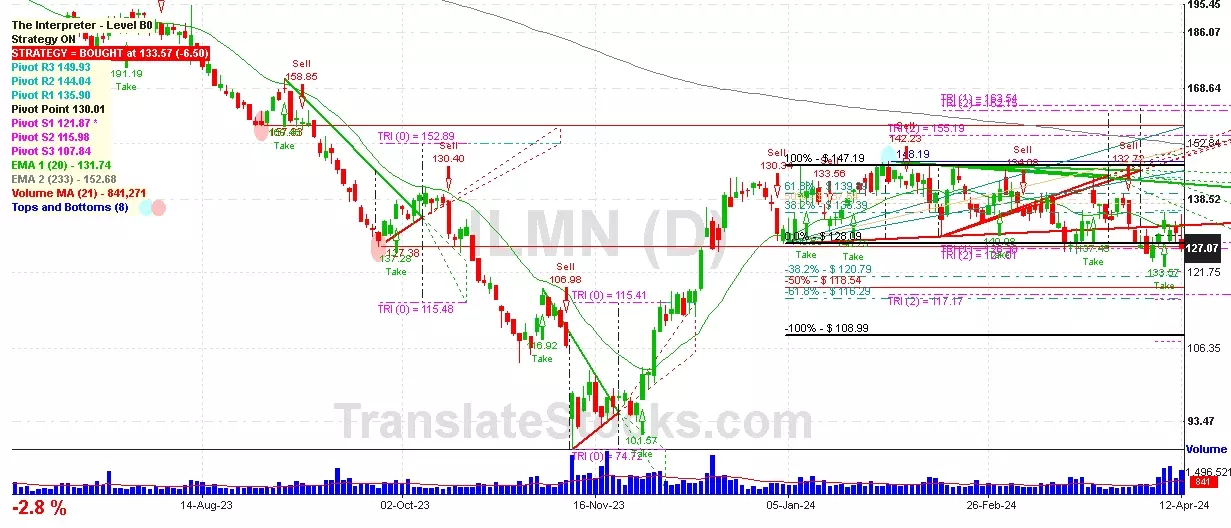
Illumina Inc
IPO: 2000-07-28
Ticker: ILMNIndices: S&P 500,
Nasdaq 100,
Exchange: Nasdaq Nms - Global Market (US - USD)
Website: https://www.illumina.com
Phone:
Common Stock
Life Sciences (
Laboratory Analytical Instruments

 Click to Enlarge