| Date | Price $ | Result % | Candle Name | Side |
|---|---|---|---|---|
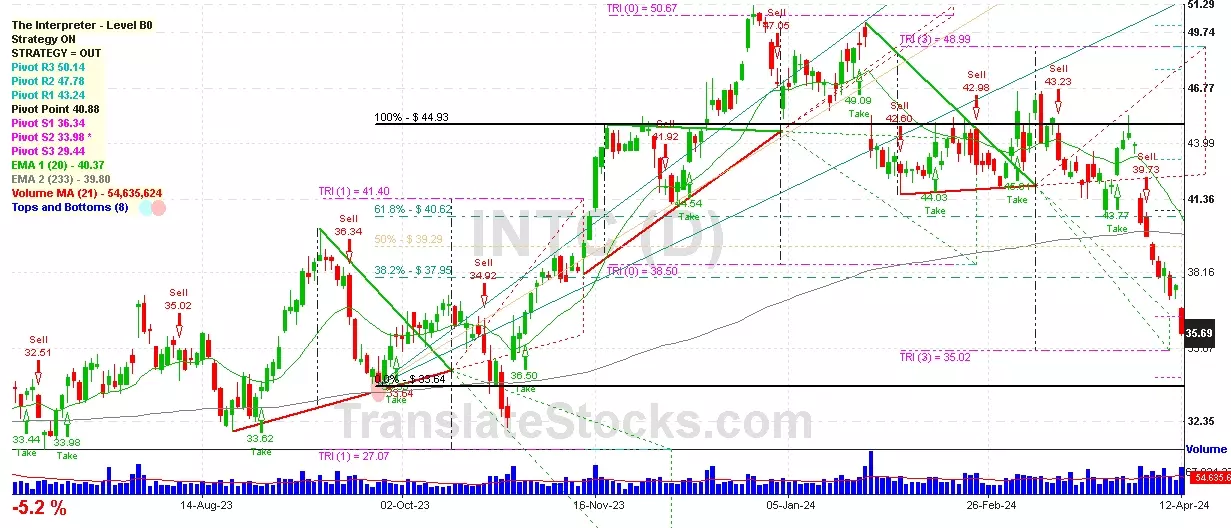
| 001 02 Apr 2024 | Sell Price: 43.94 | Profit: Open Day1 ($ 41.40) | Abandoned Baby | Sell |
| 002 26 Mar 2024 | Buy Price: 41.99 | Profit: Open Day1 ($ 42.54) | Abandoned Baby | Buy |
| 003 18 Mar 2024 | Buy Price: 42.71 | Profit: Open Day2 ($ 42.99) | Abandoned Baby | Buy |
| 004 15 Feb 2024 | Sell Price: 44.05 | Profit: Open Day1 ($ 44.03) | Dark Cloud Cover | Sell |
| 005 13 Feb 2024 | Sell Price: 43.16 | Loss: Close Day2 ($ 44.05) | Abandoned Baby | Sell |
| 006 20 Jun 2023 | Sell Price: 35.00 | Profit: Open Day1 ($ 34.92) | Engulfing | Sell |
| 007One Year Average | Both Sides Result for 6 Signals |
Profit: $ 2.58 ($ 0.43 / Signal) |
All of Them | Buy + Sell |
| Simple Moving Averages (SMA) Period | Value $ | Signal | Exponential Moving Averages (EMA) Period | Value $ | Signal | |
|---|---|---|---|---|---|---|
| 2 | 34.35 | SELL | 2 | 34.34 | SELL | |
| 3 | 34.30 | SELL | 3 | 34.46 | SELL | |
| 5 | 34.72 | SELL | 5 | 34.79 | SELL | |
| 8 | 35.23 | SELL | 8 | 35.40 | SELL | |
| 13 | 36.29 | SELL | 13 | 36.45 | SELL | |
| 21 | 38.67 | SELL | 21 | 37.82 | SELL | |
| 34 | 40.51 | SELL | 34 | 39.33 | SELL | |
| 55 | 41.59 | SELL | 55 | 40.66 | SELL | |
| 90 | 43.66 | SELL | 90 | 41.28 | SELL | |
| 200 | 39.91 | SELL | 200 | 39.92 | SELL |
Intel Corp
IPO: 1971-10-13
Ticker: INTCIndices: Dow 30,
S&P 500,
Nasdaq 100,
Exchange: Nasdaq Nms - Global Market (US - USD)
Website: https://www.intel.com/
Phone:
Common Stock
Manufacturing (
Semiconductors & Related Devices

 Click to Enlarge