| Date | Price $ | Result % | Candle Name | Side |
|---|---|---|---|---|
| 001 22 Mar 2024 | Sell Price: 32.75 | Profit: Open Day1 ($ 32.73) | Engulfing | Sell |
| 002 04 Mar 2024 | Buy Price: 31.94 | Loss: Close Day2 ($ 31.85) | Abandoned Baby | Buy |
| 003 27 Feb 2024 | Buy Price: 32.40 | Loss: Close Day2 ($ 31.40) | Abandoned Baby | Buy |
| 004 18 Jan 2024 | Buy Price: 31.77 | Profit: Close Day1 ($ 31.85) | Abandoned Baby | Buy |
| 005 07 Dec 2023 | Sell Price: 30.83 | Loss: Close Day2 ($ 31.60) | Engulfing | Sell |
| 006 23 Oct 2023 | Buy Price: 28.20 | Profit: Open Day1 ($ 28.45) | Engulfing | Buy |
| 007 27 Sep 2023 | Buy Price: 28.73 | Profit: Open Day1 ($ 28.78) | Abandoned Baby | Buy |
| 008 23 May 2023 | Sell Price: 38.39 | Profit: Open Day1 ($ 38.24) | Abandoned Baby | Sell |
| 009 15 May 2023 | Sell Price: 35.95 | Profit: Open Day1 ($ 35.86) | Engulfing | Sell |
| 010One Year Average | Both Sides Result for 9 Signals |
Loss: $ -1.22 ($ -0.14 / Signal) |
All of Them | Buy + Sell |
| Simple Moving Averages (SMA) Period | Value $ | Signal | Exponential Moving Averages (EMA) Period | Value $ | Signal | |
|---|---|---|---|---|---|---|
| 2 | 31.20 | BUY | 2 | 31.25 | BUY | |
| 3 | 31.14 | BUY | 3 | 31.14 | BUY | |
| 5 | 30.91 | BUY | 5 | 31.00 | BUY | |
| 8 | 30.70 | BUY | 8 | 30.95 | BUY | |
| 13 | 30.83 | BUY | 13 | 31.03 | BUY | |
| 21 | 31.36 | BUY | 21 | 31.25 | BUY | |
| 34 | 31.84 | SELL | 34 | 31.51 | SELL | |
| 55 | 31.91 | SELL | 55 | 31.70 | SELL | |
| 90 | 32.20 | SELL | 90 | 31.80 | SELL | |
| 200 | 31.72 | SELL | 200 | 32.20 | SELL |
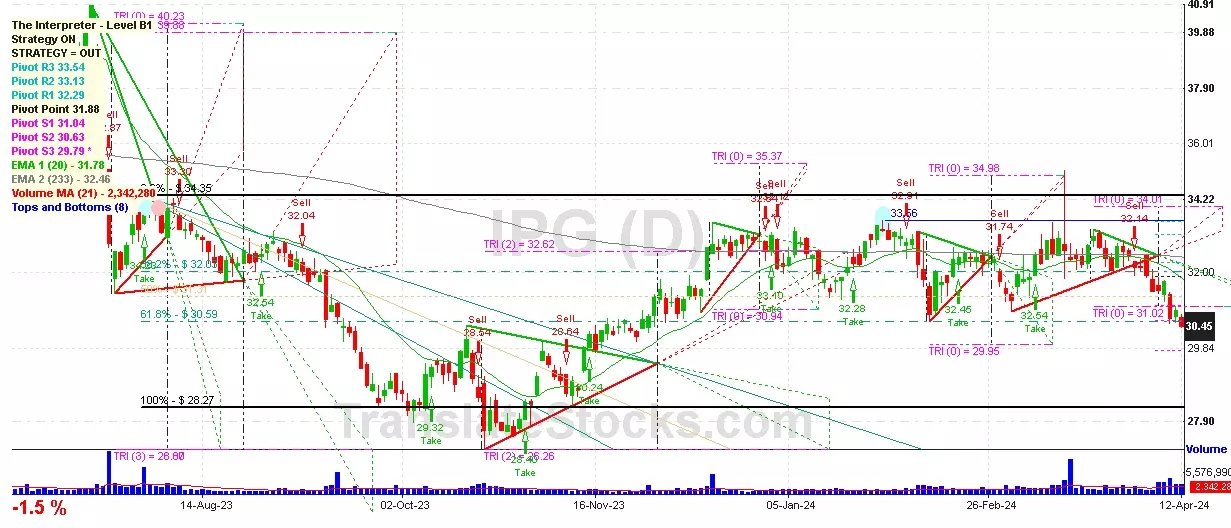
Interpublic Group Of Cos Inc
IPO: 1971-08-23
Ticker: IPGIndices: S&P 500,
Exchange: New York Stock Exchange, Inc. (US - USD)
Website: https://www.interpublic.com/
Phone:
Common Stock
Trade & Services (
Services-advertising Agencies

 Click to Enlarge