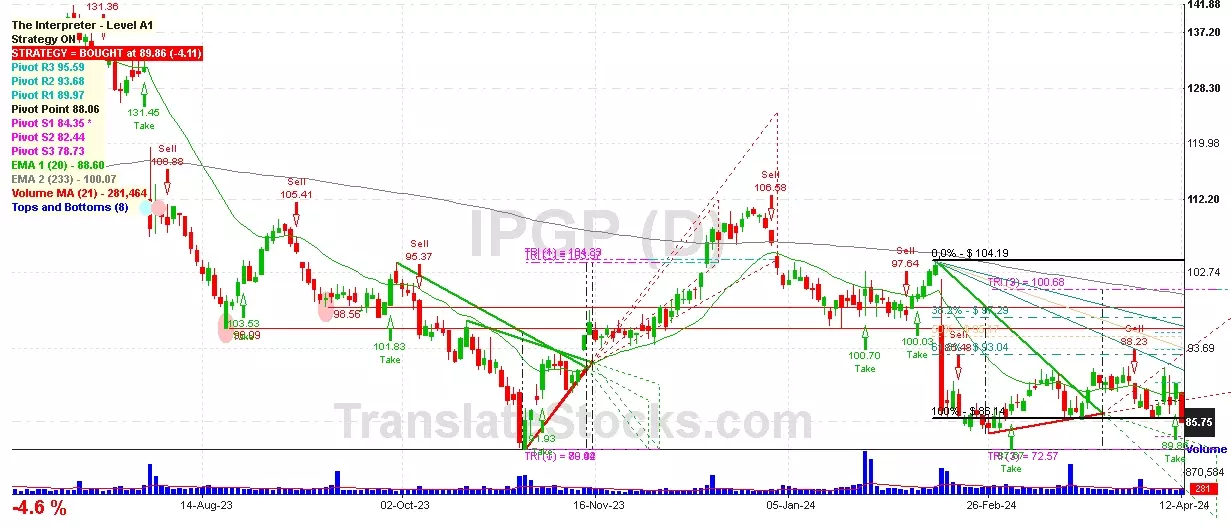
Hey Friend, I'm analysing IPG PHOTONICS CORP (IPGP), and it is between the Support of $ 84.35 (PivotS1) and the Resistance of $ 86.14 (100% of Fibonacci). The stock is also approaching the line of PivotS1 at $ 84.35, and if it goes below this line it could reach the next Support of Triangle projection at $80.44.

| Date | Price $ | Result % | Candle Name | Side |
|---|---|---|---|---|
| 001 23 Feb 2024 | Sell Price: 85.58 | Profit: Close Day1 ($ 85.19) | Abandoned Baby | Sell |
| 002 19 Jan 2024 | Sell Price: 98.56 | Loss: Close Day2 ($ 98.91) | Engulfing | Sell |
| 003 19 Jan 2024 | Sell Price: 98.63 | Loss: Close Day2 ($ 98.91) | Dark Cloud Cover | Sell |
| 004 18 Jan 2024 | Buy Price: 99.31 | Profit: Open Day1 ($ 99.92) | Abandoned Baby | Buy |
| 005 27 Nov 2023 | Buy Price: 95.89 | Profit: Open Day2 ($ 96.34) | Abandoned Baby | Buy |
| 006 27 Nov 2023 | Buy Price: 95.76 | Profit: Open Day2 ($ 96.34) | Engulfing | Buy |
| 007 01 Sep 2023 | Sell Price: 108.11 | Profit: Close Day1 ($ 106.45) | Dark Cloud Cover | Sell |
| 008 15 Aug 2023 | Buy Price: 103.30 | Loss: Close Day2 ($ 99.00) | Piercing Line | Buy |
| 009 26 Jul 2023 | Buy Price: 129.46 | Profit: Open Day1 ($ 131.11) | Engulfing | Buy |
| 010 20 Jun 2023 | Sell Price: 133.03 | Profit: Open Day1 ($ 131.74) | Abandoned Baby | Sell |
| 011 19 May 2023 | Sell Price: 112.31 | Loss: Close Day2 ($ 114.24) | Engulfing | Sell |
| 012One Year Average | Both Sides Result for 11 Signals |
Loss: $ -0.23 ($ -0.02 / Signal) |
All of Them | Buy + Sell |
| Simple Moving Averages (SMA) Period | Value $ | Signal | Exponential Moving Averages (EMA) Period | Value $ | Signal | |
|---|---|---|---|---|---|---|
| 2 | 86.71 | BUY | 2 | 87.10 | BUY | |
| 3 | 86.17 | BUY | 3 | 86.57 | BUY | |
| 5 | 85.48 | BUY | 5 | 86.08 | BUY | |
| 8 | 85.12 | BUY | 8 | 85.98 | BUY | |
| 13 | 86.33 | BUY | 13 | 86.28 | BUY | |
| 21 | 87.27 | BUY | 21 | 86.87 | BUY | |
| 34 | 87.98 | BUY | 34 | 87.87 | BUY | |
| 55 | 88.91 | SELL | 55 | 89.53 | SELL | |
| 90 | 94.31 | SELL | 90 | 91.97 | SELL | |
| 200 | 99.17 | SELL | 200 | 97.62 | SELL |
Ipg Photonics Corp
IPO: 2006-12-13
Ticker: IPGPIndices: S&P 500,
Exchange: Nasdaq Nms - Global Market (US - USD)
Website: https://www.ipgphotonics.com/
Phone:
Common Stock
Manufacturing (
Semiconductors & Related Devices
 Click to Enlarge