| Date | Price $ | Result % | Candle Name | Side |
|---|---|---|---|---|
| 001 22 Mar 2024 | Sell Price: 252.41 | Profit: Close Day1 ($ 248.88) | Engulfing | Sell |
| 002 20 Mar 2024 | Sell Price: 252.72 | Profit: Close Day2 ($ 252.41) | Engulfing | Sell |
| 003 13 Mar 2024 | Sell Price: 255.65 | Profit: Open Day1 ($ 255.11) | Engulfing | Sell |
| 004 23 Jan 2024 | Sell Price: 213.53 | Profit: Close Day1 ($ 212.88) | Abandoned Baby | Sell |
| 005 29 Dec 2023 | Sell Price: 231.38 | Profit: Open Day1 ($ 229.66) | Abandoned Baby | Sell |
| 006 20 Dec 2023 | Sell Price: 225.00 | Loss: Close Day2 ($ 229.37) | Engulfing | Sell |
| 007 24 Aug 2023 | Sell Price: 215.51 | Loss: Close Day2 ($ 221.79) | Engulfing | Sell |
| 008 22 Aug 2023 | Sell Price: 214.02 | Loss: Close Day2 ($ 215.51) | Engulfing | Sell |
| 009 14 Aug 2023 | Buy Price: 220.12 | Loss: Close Day2 ($ 215.20) | Piercing Line | Buy |
| 010One Year Average | Both Sides Result for 9 Signals |
Loss: $ -10.31 ($ -1.15 / Signal) |
All of Them | Buy + Sell |
| Simple Moving Averages (SMA) Period | Value $ | Signal | Exponential Moving Averages (EMA) Period | Value $ | Signal | |
|---|---|---|---|---|---|---|
| 2 | 239.73 | BUY | 2 | 239.16 | BUY | |
| 3 | 236.93 | BUY | 3 | 237.52 | BUY | |
| 5 | 233.21 | BUY | 5 | 235.56 | BUY | |
| 8 | 231.70 | BUY | 8 | 234.88 | BUY | |
| 13 | 234.78 | BUY | 13 | 235.89 | BUY | |
| 21 | 239.17 | BUY | 21 | 238.07 | BUY | |
| 34 | 245.16 | SELL | 34 | 239.43 | BUY | |
| 55 | 242.26 | SELL | 55 | 238.03 | BUY | |
| 90 | 233.70 | BUY | 90 | 233.60 | BUY | |
| 200 | 220.15 | BUY | 200 | 224.37 | BUY |
Iqvia Holdings Inc
IPO: 2013-05-09
Ticker: IQVIndices: S&P 500,
Exchange: New York Stock Exchange, Inc. (US - USD)
Website: https://ir.iqvia.com/
Phone:
Common Stock
Trade & Services (
Services-commercial Physical & Biological Research
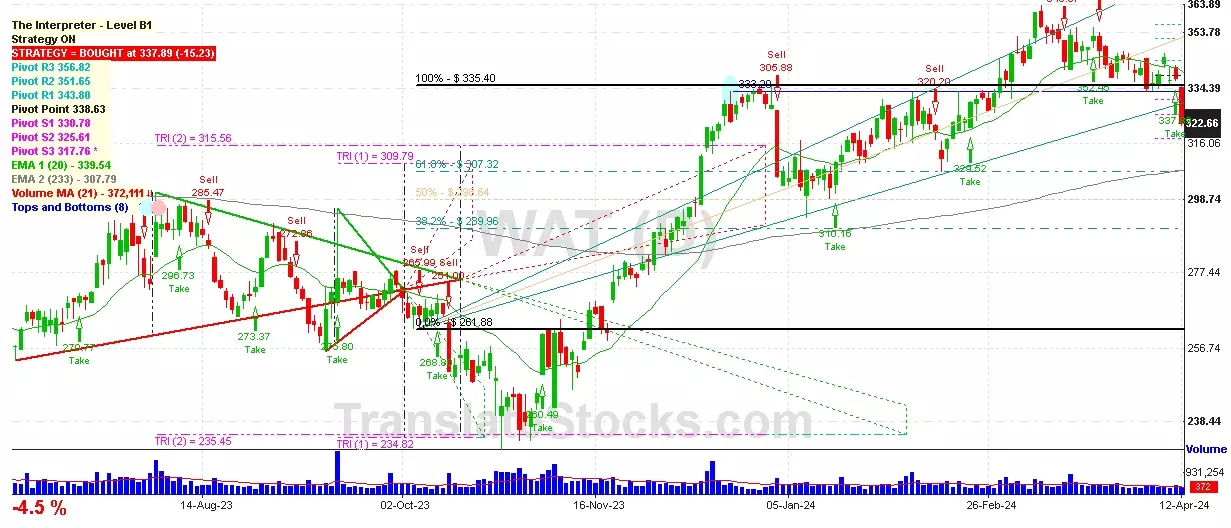
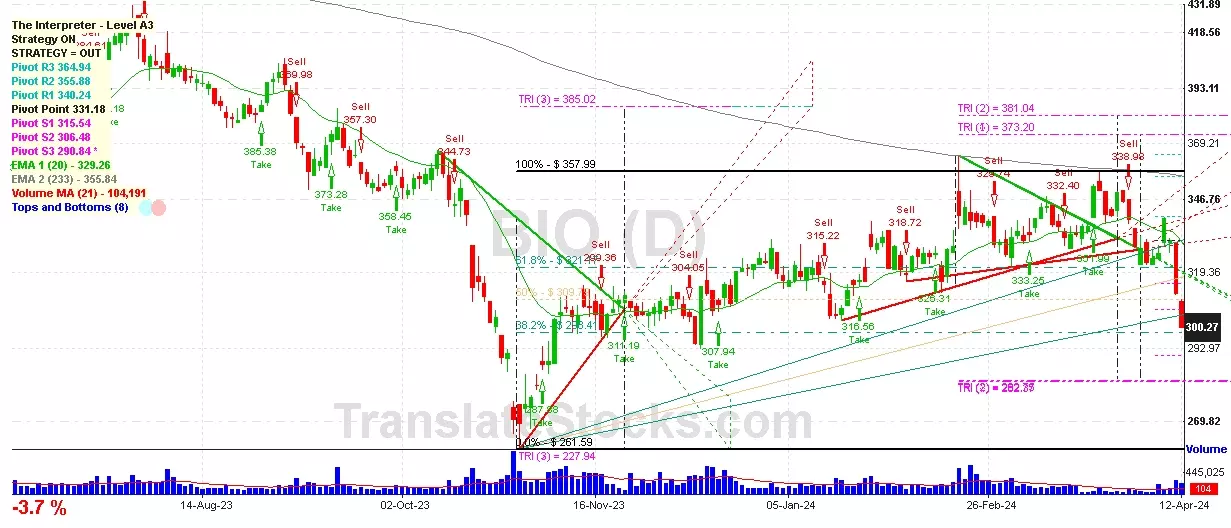
 Click to Enlarge
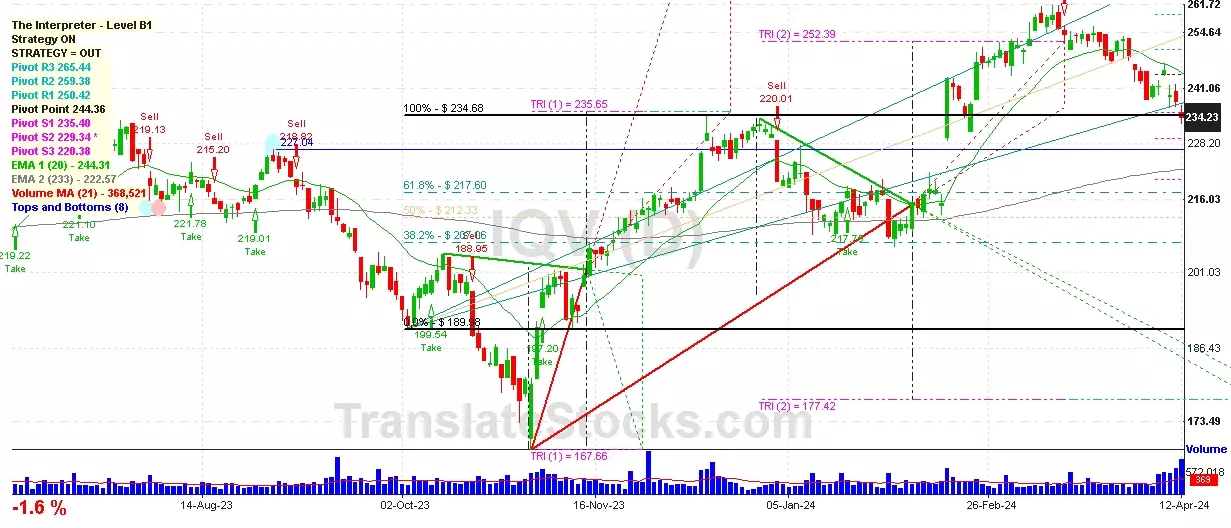