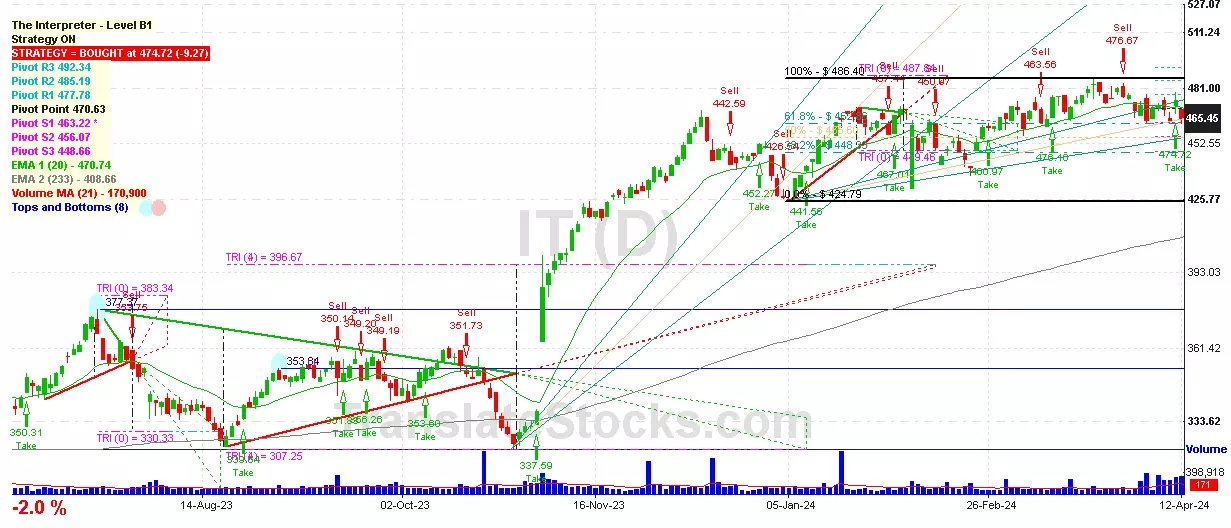
Hey Friend, I'm analysing GARTNER INC (IT), and it is between the Support of $ 463.22 (PivotS1) and the Resistance of $ 470.63 (Pivot). The stock is also approaching the line of PivotS1 at $ 463.22, and if it goes below this line it could reach the next Support of 61.8% of Fibonacci at $ 462.86.

| Date | Price $ | Result % | Candle Name | Side |
|---|---|---|---|---|
| 001 03 Apr 2024 | Buy Price: 472.09 | Profit: Open Day1 ($ 475.43) | Piercing Line | Buy |
| 002 08 Mar 2024 | Sell Price: 463.56 | Profit: Open Day1 ($ 461.19) | Abandoned Baby | Sell |
| 003 24 Nov 2023 | Sell Price: 426.85 | Profit: Open Day1 ($ 426.83) | Abandoned Baby | Sell |
| 004 20 Oct 2023 | Sell Price: 348.76 | Profit: Open Day1 ($ 345.90) | Engulfing | Sell |
| 005 19 Oct 2023 | Buy Price: 353.03 | Profit: Open Day1 ($ 353.41) | Abandoned Baby | Buy |
| 006 13 Sep 2023 | Buy Price: 353.19 | Profit: Open Day1 ($ 355.13) | Abandoned Baby | Buy |
| 007 31 Aug 2023 | Sell Price: 349.68 | Profit: Open Day2 ($ 348.75) | Dark Cloud Cover | Sell |
| 008 20 Jun 2023 | Sell Price: 353.36 | Profit: Open Day1 ($ 353.21) | Abandoned Baby | Sell |
| 009 02 Jun 2023 | Buy Price: 345.01 | Loss: Close Day2 ($ 339.38) | Abandoned Baby | Buy |
| 010 02 May 2023 | Sell Price: 301.92 | Profit: Close Day2 ($ 300.65) | Engulfing | Sell |
| 011 02 May 2023 | Sell Price: 301.99 | Profit: Close Day2 ($ 300.65) | Dark Cloud Cover | Sell |
| 012One Year Average | Both Sides Result for 11 Signals |
Profit: $ 8.97 ($ 0.82 / Signal) |
All of Them | Buy + Sell |
| Simple Moving Averages (SMA) Period | Value $ | Signal | Exponential Moving Averages (EMA) Period | Value $ | Signal | |
|---|---|---|---|---|---|---|
| 2 | 450.66 | BUY | 2 | 450.02 | BUY | |
| 3 | 448.13 | BUY | 3 | 449.29 | BUY | |
| 5 | 446.87 | BUY | 5 | 449.61 | BUY | |
| 8 | 450.68 | BUY | 8 | 451.82 | SELL | |
| 13 | 457.78 | SELL | 13 | 455.64 | SELL | |
| 21 | 463.70 | SELL | 21 | 459.57 | SELL | |
| 34 | 467.57 | SELL | 34 | 461.86 | SELL | |
| 55 | 463.67 | SELL | 55 | 460.27 | SELL | |
| 90 | 458.97 | SELL | 90 | 451.41 | SELL | |
| 200 | 408.90 | BUY | 200 | 419.11 | BUY |
Gartner Inc
IPO: 1998-09-15
Ticker: ITIndices: S&P 500,
Exchange: New York Stock Exchange, Inc. (US - USD)
Website: https://www.gartner.com/en
Phone:
Common Stock
Trade & Services (
Services-management Services
 Click to Enlarge