| Date | Price $ | Result % | Candle Name | Side |
|---|---|---|---|---|
| 001 29 Feb 2024 | Sell Price: 59.27 | Profit: Open Day1 ($ 59.17) | Engulfing | Sell |
| 002 29 Feb 2024 | Sell Price: 59.36 | Profit: Open Day1 ($ 59.17) | Dark Cloud Cover | Sell |
| 003 24 Jan 2024 | Sell Price: 55.02 | Loss: Close Day2 ($ 56.59) | Engulfing | Sell |
| 004 24 Jan 2024 | Sell Price: 55.21 | Loss: Close Day2 ($ 56.59) | Dark Cloud Cover | Sell |
| 005 04 Jan 2024 | Buy Price: 56.72 | Profit: Close Day1 ($ 57.18) | Engulfing | Buy |
| 006 24 Nov 2023 | Sell Price: 52.40 | Profit: Open Day1 ($ 52.15) | Engulfing | Sell |
| 007 06 Oct 2023 | Buy Price: 52.35 | Profit: Close Day1 ($ 52.62) | Engulfing | Buy |
| 008 08 Sep 2023 | Buy Price: 57.35 | Profit: Open Day1 ($ 57.74) | Engulfing | Buy |
| 009 17 Aug 2023 | Sell Price: 59.16 | Profit: Open Day1 ($ 58.68) | Engulfing | Sell |
| 010 28 Jul 2023 | Sell Price: 69.19 | Loss: Close Day2 ($ 70.03) | Dark Cloud Cover | Sell |
| 011 26 Jun 2023 | Buy Price: 66.00 | Profit: Open Day1 ($ 66.20) | Abandoned Baby | Buy |
| 012 22 May 2023 | Sell Price: 63.00 | Profit: Open Day1 ($ 62.44) | Abandoned Baby | Sell |
| 013One Year Average | Both Sides Result for 12 Signals |
Loss: $ -0.90 ($ -0.08 / Signal) |
All of Them | Buy + Sell |
| Simple Moving Averages (SMA) Period | Value $ | Signal | Exponential Moving Averages (EMA) Period | Value $ | Signal | |
|---|---|---|---|---|---|---|
| 2 | 63.96 | SELL | 2 | 63.92 | SELL | |
| 3 | 64.11 | SELL | 3 | 64.11 | SELL | |
| 5 | 64.56 | SELL | 5 | 64.38 | SELL | |
| 8 | 64.84 | SELL | 8 | 64.57 | SELL | |
| 13 | 64.96 | SELL | 13 | 64.58 | SELL | |
| 21 | 64.70 | SELL | 21 | 64.16 | SELL | |
| 34 | 63.45 | BUY | 34 | 63.13 | BUY | |
| 55 | 60.63 | BUY | 55 | 61.60 | BUY | |
| 90 | 58.71 | BUY | 90 | 59.98 | BUY | |
| 200 | 57.96 | BUY | 200 | 58.85 | BUY |
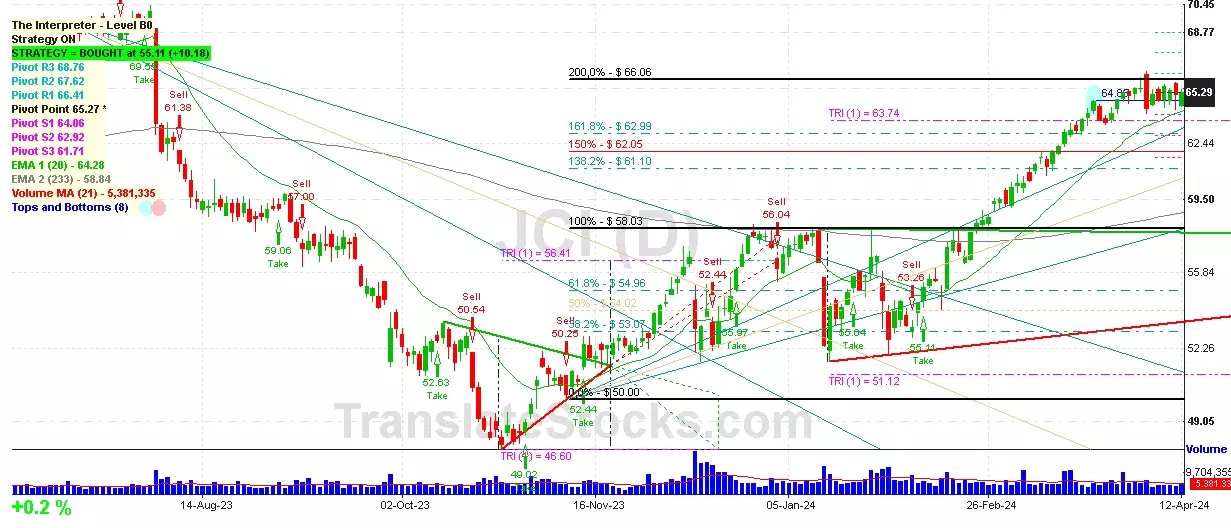
Johnson Controls Internation
IPO: 1991-08-22
Ticker: JCIIndices: S&P 500,
Exchange: New York Stock Exchange, Inc. (IE - USD)
Website: https://www.johnsoncontrols.com/
Phone:
Common Stock
Trade & Services (
Services-miscellaneous Business Services

 Click to Enlarge