| Date | Price $ | Result % | Candle Name | Side |
|---|---|---|---|---|
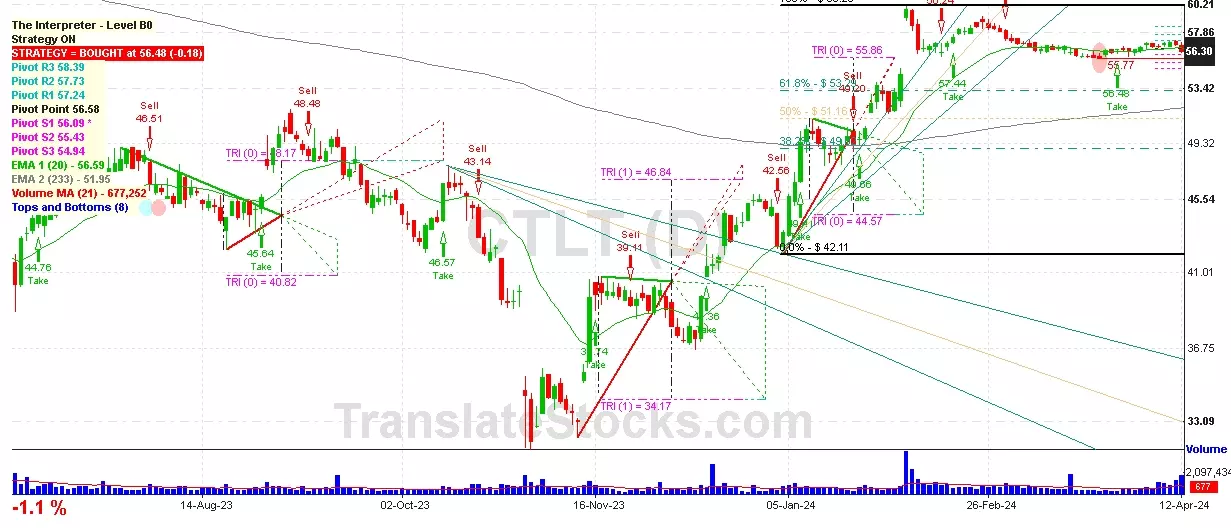
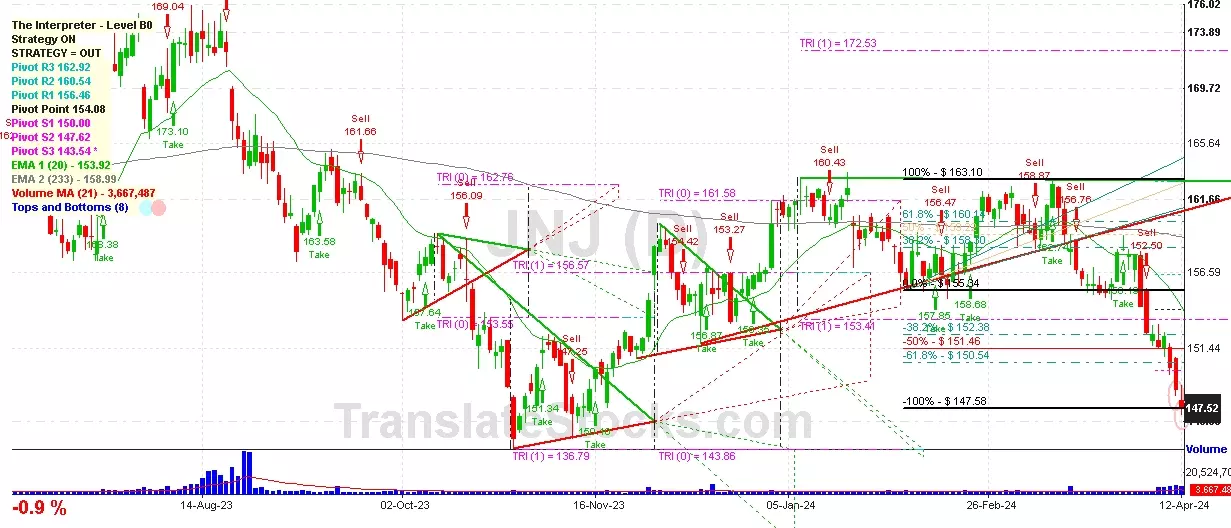
| 001 01 Apr 2024 | Sell Price: 157.78 | Profit: Open Day1 ($ 156.57) | Abandoned Baby | Sell |
| 002 26 Oct 2023 | Sell Price: 149.00 | Profit: Open Day1 ($ 148.49) | Engulfing | Sell |
| 003 25 Oct 2023 | Buy Price: 151.57 | Profit: Open Day1 ($ 151.97) | Abandoned Baby | Buy |
| 004 20 Oct 2023 | Buy Price: 153.00 | Loss: Close Day2 ($ 151.23) | Abandoned Baby | Buy |
| 005 14 Sep 2023 | Sell Price: 163.74 | Profit: Close Day1 ($ 161.45) | Engulfing | Sell |
| 006 24 Aug 2023 | Buy Price: 165.09 | Profit: Close Day1 ($ 166.25) | Piercing Line | Buy |
| 007 22 Jun 2023 | Buy Price: 165.62 | Profit: Open Day1 ($ 166.11) | Abandoned Baby | Buy |
| 008 01 Jun 2023 | Sell Price: 154.54 | Loss: Close Day2 ($ 158.32) | Abandoned Baby | Sell |
| 009One Year Average | Both Sides Result for 8 Signals |
Profit: $ 0.51 ($ 0.06 / Signal) |
All of Them | Buy + Sell |
| Simple Moving Averages (SMA) Period | Value $ | Signal | Exponential Moving Averages (EMA) Period | Value $ | Signal | |
|---|---|---|---|---|---|---|
| 2 | 146.83 | BUY | 2 | 147.11 | BUY | |
| 3 | 146.14 | BUY | 3 | 146.78 | BUY | |
| 5 | 146.09 | BUY | 5 | 146.85 | BUY | |
| 8 | 147.12 | BUY | 8 | 147.62 | BUY | |
| 13 | 149.23 | SELL | 13 | 149.12 | SELL | |
| 21 | 152.08 | SELL | 21 | 151.07 | SELL | |
| 34 | 154.78 | SELL | 34 | 153.07 | SELL | |
| 55 | 156.23 | SELL | 55 | 154.67 | SELL | |
| 90 | 157.16 | SELL | 90 | 155.82 | SELL | |
| 200 | 158.47 | SELL | 200 | 157.90 | SELL |
Common Stock
Life Sciences (
Pharmaceutical Preparations

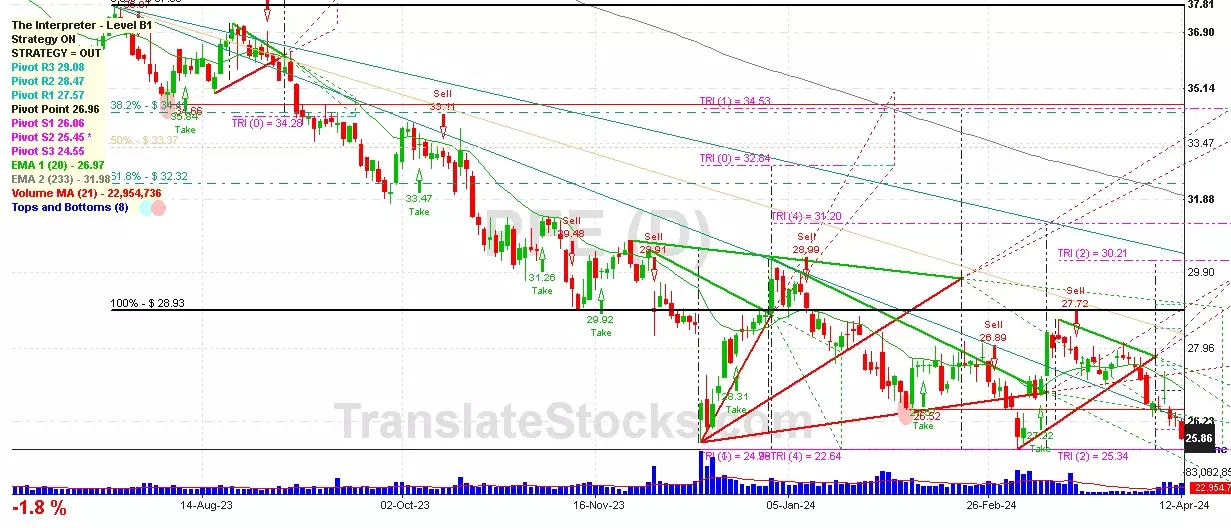
 Click to Enlarge
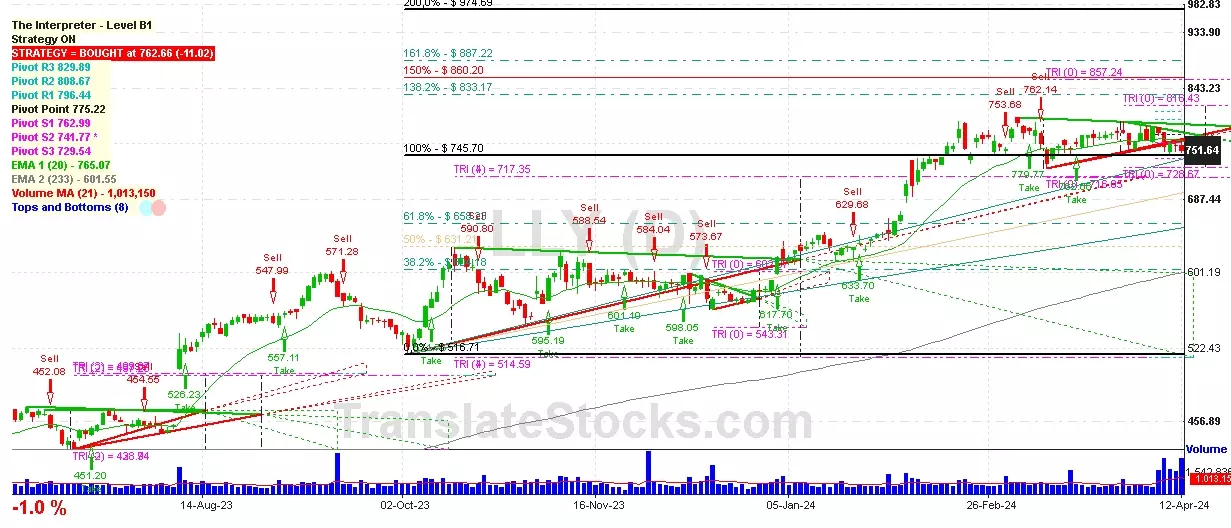