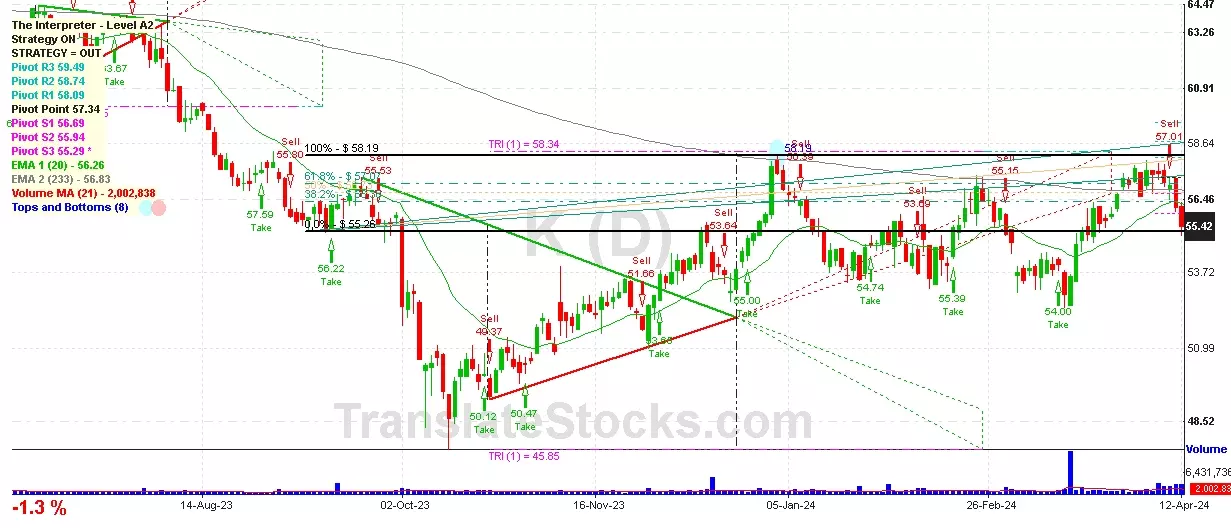
Hey Friend, I'm analysing KELLOGG CO (K), and it is between the Support of $ 55.29 (PivotS3) and the Resistance of $ 55.94 (PivotS2). The stock is also approaching the line of PivotS3 at $ 55.29, and if it goes below this line it could reach the next Support of 0% of Fibonacci at $ 55.26.

| Date | Price $ | Result % | Candle Name | Side |
|---|---|---|---|---|
| 001 07 Mar 2024 | Sell Price: 53.60 | Profit: Open Day1 ($ 53.53) | Engulfing | Sell |
| 002 24 Aug 2023 | Sell Price: 60.83 | Loss: Close Day2 ($ 61.37) | Dark Cloud Cover | Sell |
| 003 04 May 2023 | Sell Price: 70.38 | Profit: Close Day1 ($ 70.35) | Abandoned Baby | Sell |
| 004One Year Average | Both Sides Result for 3 Signals |
Loss: $ -0.44 ($ -0.15 / Signal) |
All of Them | Buy + Sell |
| Simple Moving Averages (SMA) Period | Value $ | Signal | Exponential Moving Averages (EMA) Period | Value $ | Signal | |
|---|---|---|---|---|---|---|
| 2 | 56.96 | BUY | 2 | 57.03 | BUY | |
| 3 | 56.66 | BUY | 3 | 56.79 | BUY | |
| 5 | 56.18 | BUY | 5 | 56.55 | BUY | |
| 8 | 56.19 | BUY | 8 | 56.46 | BUY | |
| 13 | 56.59 | BUY | 13 | 56.41 | BUY | |
| 21 | 56.55 | BUY | 21 | 56.25 | BUY | |
| 34 | 55.59 | BUY | 34 | 55.98 | BUY | |
| 55 | 55.44 | BUY | 55 | 55.66 | BUY | |
| 90 | 55.26 | BUY | 90 | 55.58 | BUY | |
| 200 | 55.59 | BUY | 200 | 57.40 | SELL |
Kellogg Co
IPO: 1952-01-09
Ticker: KIndices: S&P 500,
Exchange: New York Stock Exchange, Inc. (US - USD)
Website: https://www.kelloggcompany.com/
Phone:
Common Stock
Manufacturing (
Grain Mill Products
 Click to Enlarge