| Date | Price $ | Result % | Candle Name | Side |
|---|---|---|---|---|
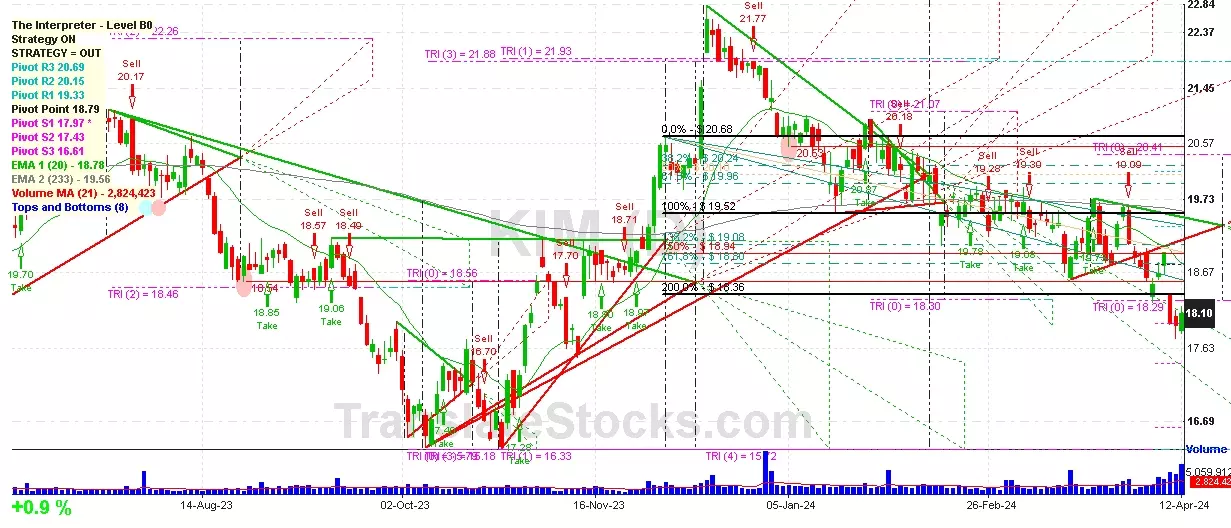
| 001 23 Feb 2024 | Sell Price: 19.54 | Profit: Open Day1 ($ 19.49) | Abandoned Baby | Sell |
| 002 16 Feb 2024 | Sell Price: 19.63 | Profit: Open Day1 ($ 19.48) | Abandoned Baby | Sell |
| 003 08 Dec 2023 | Buy Price: 20.24 | Profit: Close Day1 ($ 20.35) | Piercing Line | Buy |
| 004 22 Nov 2023 | Buy Price: 18.75 | Profit: Open Day1 ($ 18.76) | Abandoned Baby | Buy |
| 005 13 Sep 2023 | Sell Price: 18.57 | Loss: Close Day2 ($ 18.88) | Dark Cloud Cover | Sell |
| 006 22 May 2023 | Buy Price: 18.78 | Profit: Open Day1 ($ 18.81) | Engulfing | Buy |
| 007 27 Apr 2023 | Buy Price: 18.99 | Profit: Close Day1 ($ 19.19) | Abandoned Baby | Buy |
| 008One Year Average | Both Sides Result for 7 Signals |
Profit: $ 0.24 ($ 0.03 / Signal) |
All of Them | Buy + Sell |
| Simple Moving Averages (SMA) Period | Value $ | Signal | Exponential Moving Averages (EMA) Period | Value $ | Signal | |
|---|---|---|---|---|---|---|
| 2 | 18.62 | BUY | 2 | 18.56 | BUY | |
| 3 | 18.48 | BUY | 3 | 18.46 | BUY | |
| 5 | 18.15 | BUY | 5 | 18.32 | BUY | |
| 8 | 18.07 | BUY | 8 | 18.26 | BUY | |
| 13 | 18.20 | BUY | 13 | 18.31 | BUY | |
| 21 | 18.50 | BUY | 21 | 18.47 | BUY | |
| 34 | 18.79 | SELL | 34 | 18.72 | SELL | |
| 55 | 19.15 | SELL | 55 | 19.01 | SELL | |
| 90 | 19.86 | SELL | 90 | 19.22 | SELL | |
| 200 | 19.28 | SELL | 200 | 19.40 | SELL |
Kimco Realty Corp
IPO: 1991-11-22
Ticker: KIMIndices: S&P 500,
Exchange: New York Stock Exchange, Inc. (US - USD)
Website: https://www.kimcorealty.com/
Phone:
REIT (Real Estate Investment Trust)
Real Estate & Construction (
Real Estate Investment Trusts

 Click to Enlarge