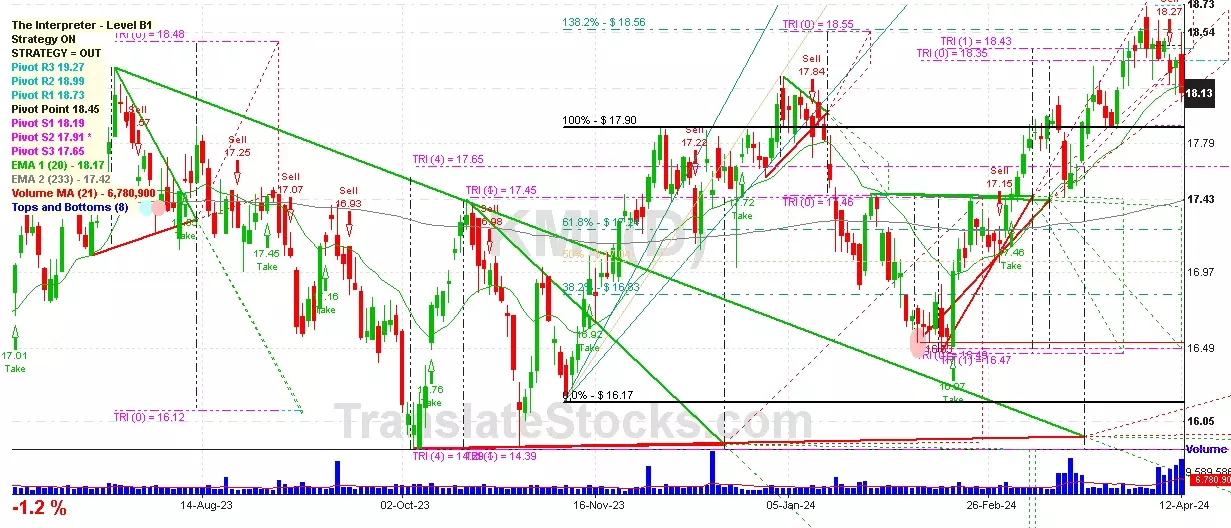
| Date | Price $ | Result % | Candle Name | Side |
|---|---|---|---|---|
| 001 08 Mar 2024 | Sell Price: 17.83 | Loss: Close Day2 ($ 17.94) | Abandoned Baby | Sell |
| 002 03 Aug 2023 | Buy Price: 17.46 | Profit: Open Day1 ($ 17.51) | Abandoned Baby | Buy |
| 003 08 May 2023 | Sell Price: 16.90 | Profit: Open Day1 ($ 16.78) | Engulfing | Sell |
| 004 08 May 2023 | Sell Price: 16.91 | Profit: Open Day1 ($ 16.78) | Dark Cloud Cover | Sell |
| 005One Year Average | Both Sides Result for 4 Signals |
Profit: $ 0.18 ($ 0.05 / Signal) |
All of Them | Buy + Sell |
| Simple Moving Averages (SMA) Period | Value $ | Signal | Exponential Moving Averages (EMA) Period | Value $ | Signal | |
|---|---|---|---|---|---|---|
| 2 | 18.79 | BUY | 2 | 18.79 | BUY | |
| 3 | 18.80 | BUY | 3 | 18.75 | BUY | |
| 5 | 18.69 | BUY | 5 | 18.65 | BUY | |
| 8 | 18.36 | BUY | 8 | 18.53 | BUY | |
| 13 | 18.34 | BUY | 13 | 18.43 | BUY | |
| 21 | 18.34 | BUY | 21 | 18.31 | BUY | |
| 34 | 18.16 | BUY | 34 | 18.15 | BUY | |
| 55 | 17.75 | BUY | 55 | 17.95 | BUY | |
| 90 | 17.67 | BUY | 90 | 17.75 | BUY | |
| 200 | 17.35 | BUY | 200 | 17.51 | BUY |
Kinder Morgan Inc
IPO: 2011-02-11
Ticker: KMIIndices: S&P 500,
Exchange: New York Stock Exchange, Inc. (US - USD)
Website: https://www.kindermorgan.com/
Phone:
Common Stock
Energy & Transportation (
Natural Gas Transmission

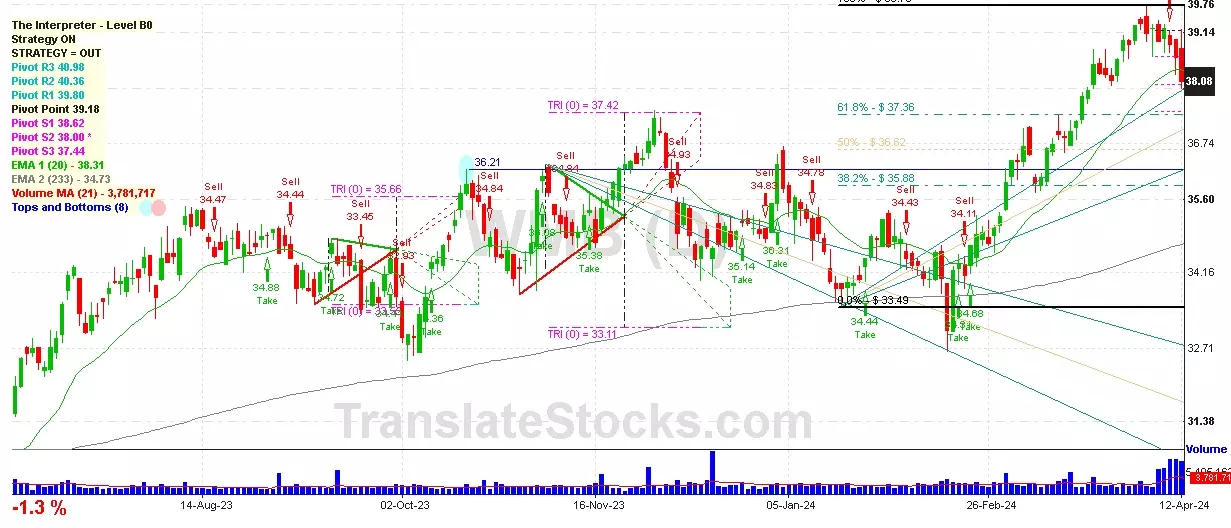
 Click to Enlarge
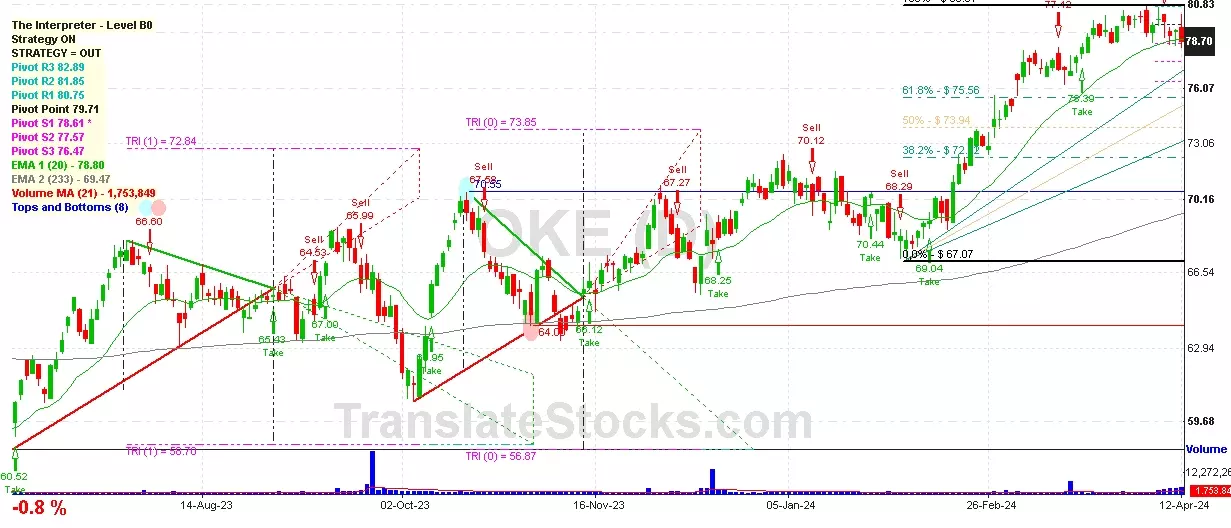