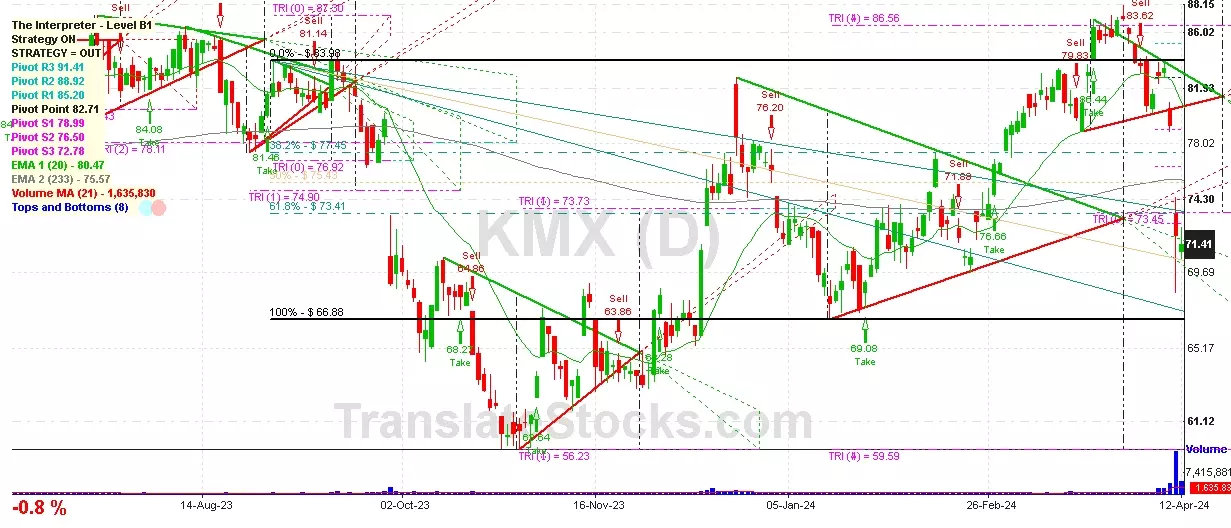
Hey Friend, I'm analysing CARMAX INC (KMX), and it is between the Support of $ 66.88 (100% of Fibonacci) and the Resistance of $ 72.78 (PivotS3). The stock is also approaching the line of PivotS3 at $ 72.78, and if it goes above this line it could reach the next Resistance of 61.8% of Fibonacci at $ 73.41.

| Date | Price $ | Result % | Candle Name | Side |
|---|---|---|---|---|
| 001 12 Mar 2024 | Buy Price: 82.01 | Profit: Close Day1 ($ 83.22) | Engulfing | Buy |
| 002 22 Feb 2024 | Buy Price: 72.89 | Profit: Open Day1 ($ 73.21) | Abandoned Baby | Buy |
| 003 17 Oct 2023 | Buy Price: 68.47 | Loss: Close Day2 ($ 63.42) | Piercing Line | Buy |
| 004 12 Sep 2023 | Buy Price: 81.56 | Profit: Open Day1 ($ 81.57) | Piercing Line | Buy |
| 005 11 Aug 2023 | Buy Price: 85.19 | Profit: Close Day1 ($ 85.44) | Engulfing | Buy |
| 006 07 Jul 2023 | Buy Price: 81.39 | Profit: Close Day1 ($ 82.65) | Engulfing | Buy |
| 007 07 Jul 2023 | Buy Price: 81.38 | Profit: Close Day1 ($ 82.65) | Piercing Line | Buy |
| 008 31 May 2023 | Sell Price: 72.21 | Profit: Close Day1 ($ 71.81) | Abandoned Baby | Sell |
| 009One Year Average | Both Sides Result for 8 Signals |
Loss: $ -0.33 ($ -0.04 / Signal) |
All of Them | Buy + Sell |
| Simple Moving Averages (SMA) Period | Value $ | Signal | Exponential Moving Averages (EMA) Period | Value $ | Signal | |
|---|---|---|---|---|---|---|
| 2 | 68.13 | BUY | 2 | 68.32 | BUY | |
| 3 | 68.26 | BUY | 3 | 68.56 | SELL | |
| 5 | 68.81 | SELL | 5 | 69.52 | SELL | |
| 8 | 70.84 | SELL | 8 | 71.33 | SELL | |
| 13 | 75.29 | SELL | 13 | 73.82 | SELL | |
| 21 | 79.34 | SELL | 21 | 76.03 | SELL | |
| 34 | 80.02 | SELL | 34 | 77.12 | SELL | |
| 55 | 77.66 | SELL | 55 | 76.90 | SELL | |
| 90 | 75.63 | SELL | 90 | 75.91 | SELL | |
| 200 | 74.96 | SELL | 200 | 74.92 | SELL |
Carmax Inc
IPO: 1997-02-07
Ticker: KMXIndices: S&P 500,
Exchange: New York Stock Exchange, Inc. (US - USD)
Website: https://www.carmax.com/
Phone:
Common Stock
Trade & Services (
Retail-auto Dealers & Gasoline Stations
 Click to Enlarge