| Date | Price $ | Result % | Candle Name | Side |
|---|---|---|---|---|
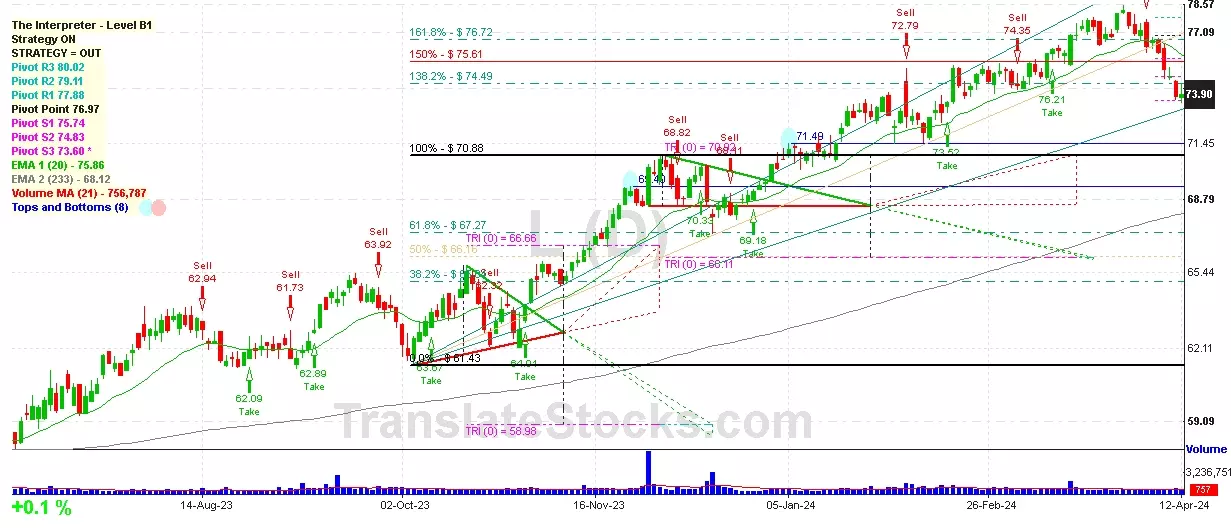
| 001 11 Mar 2024 | Buy Price: 76.00 | Profit: Open Day1 ($ 76.01) | Engulfing | Buy |
| 002 13 Feb 2024 | Sell Price: 73.02 | Loss: Close Day2 ($ 75.22) | Dark Cloud Cover | Sell |
| 003 06 Nov 2023 | Sell Price: 65.40 | Profit: Open Day1 ($ 65.29) | Engulfing | Sell |
| 004 15 Sep 2023 | Sell Price: 64.25 | Loss: Close Day2 ($ 65.08) | Abandoned Baby | Sell |
| 005 17 Aug 2023 | Sell Price: 61.61 | Profit: Open Day1 ($ 61.41) | Engulfing | Sell |
| 006 04 Aug 2023 | Sell Price: 62.92 | Loss: Close Day2 ($ 63.61) | Dark Cloud Cover | Sell |
| 007One Year Average | Both Sides Result for 6 Signals |
Loss: $ -3.40 ($ -0.57 / Signal) |
All of Them | Buy + Sell |
| Simple Moving Averages (SMA) Period | Value $ | Signal | Exponential Moving Averages (EMA) Period | Value $ | Signal | |
|---|---|---|---|---|---|---|
| 2 | 76.77 | BUY | 2 | 76.70 | BUY | |
| 3 | 76.67 | BUY | 3 | 76.47 | BUY | |
| 5 | 75.90 | BUY | 5 | 76.02 | BUY | |
| 8 | 74.92 | BUY | 8 | 75.64 | BUY | |
| 13 | 74.86 | BUY | 13 | 75.50 | BUY | |
| 21 | 75.77 | BUY | 21 | 75.53 | BUY | |
| 34 | 76.04 | BUY | 34 | 75.43 | BUY | |
| 55 | 75.31 | BUY | 55 | 74.83 | BUY | |
| 90 | 73.61 | BUY | 90 | 73.43 | BUY | |
| 200 | 68.41 | BUY | 200 | 69.48 | BUY |
Loews Corp
IPO: 1959-03-13
Ticker: LIndices: S&P 500,
Exchange: New York Stock Exchange, Inc. (US - USD)
Website: https://www.loews.com/
Phone:
Common Stock
Finance (
Fire, Marine & Casualty Insurance

 Click to Enlarge