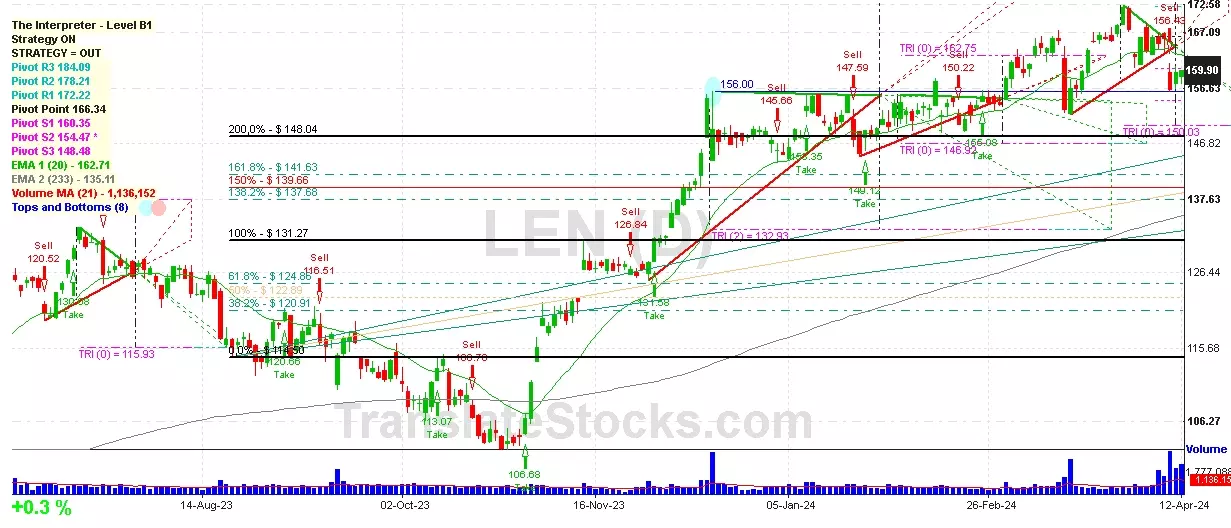
Hey Friend, I'm analysing LENNAR CORP A (LEN), and it is between the Support of $ 154.47 (PivotS2) and the Resistance of $ 160.35 (PivotS1). The stock is also approaching the line of PivotS1 at $ 160.35, and if it goes above this line it could reach the next Resistance of Triangle projection at $162.75.

| Date | Price $ | Result % | Candle Name | Side |
|---|---|---|---|---|
| 001 20 Feb 2024 | Buy Price: 150.99 | Profit: Open Day1 ($ 152.83) | Piercing Line | Buy |
| 002 12 Feb 2024 | Buy Price: 157.91 | Loss: Close Day2 ($ 153.87) | Abandoned Baby | Buy |
| 003 09 Feb 2024 | Sell Price: 153.02 | Profit: Open Day2 ($ 151.66) | Abandoned Baby | Sell |
| 004 24 Nov 2023 | Buy Price: 127.63 | Loss: Close Day2 ($ 126.06) | Piercing Line | Buy |
| 005 24 Aug 2023 | Sell Price: 115.89 | Profit: Close Day1 ($ 114.04) | Abandoned Baby | Sell |
| 006 14 Jun 2023 | Sell Price: 114.75 | Loss: Close Day2 ($ 120.02) | Engulfing | Sell |
| 007 19 May 2023 | Sell Price: 113.59 | Profit: Open Day1 ($ 113.37) | Engulfing | Sell |
| 008One Year Average | Both Sides Result for 7 Signals |
Loss: $ -5.61 ($ -0.80 / Signal) |
All of Them | Buy + Sell |
| Simple Moving Averages (SMA) Period | Value $ | Signal | Exponential Moving Averages (EMA) Period | Value $ | Signal | |
|---|---|---|---|---|---|---|
| 2 | 152.23 | SELL | 2 | 152.64 | SELL | |
| 3 | 153.53 | SELL | 3 | 153.61 | SELL | |
| 5 | 155.99 | SELL | 5 | 155.36 | SELL | |
| 8 | 158.42 | SELL | 8 | 157.34 | SELL | |
| 13 | 161.05 | SELL | 13 | 159.27 | SELL | |
| 21 | 162.90 | SELL | 21 | 160.35 | SELL | |
| 34 | 162.12 | SELL | 34 | 160.00 | SELL | |
| 55 | 158.63 | SELL | 55 | 157.59 | SELL | |
| 90 | 154.50 | SELL | 90 | 152.38 | SELL | |
| 200 | 135.18 | BUY | 200 | 138.64 | BUY |
Lennar Corp-a
IPO: 1972-07-27
Ticker: LENIndices: S&P 500,
Exchange: New York Stock Exchange, Inc. (US - USD)
Website: https://www.lennar.com/
Phone:
Common Stock
Real Estate & Construction (
General Bldg Contractors - Residential Bldgs
 Click to Enlarge