| Date | Price $ | Result % | Candle Name | Side |
|---|---|---|---|---|
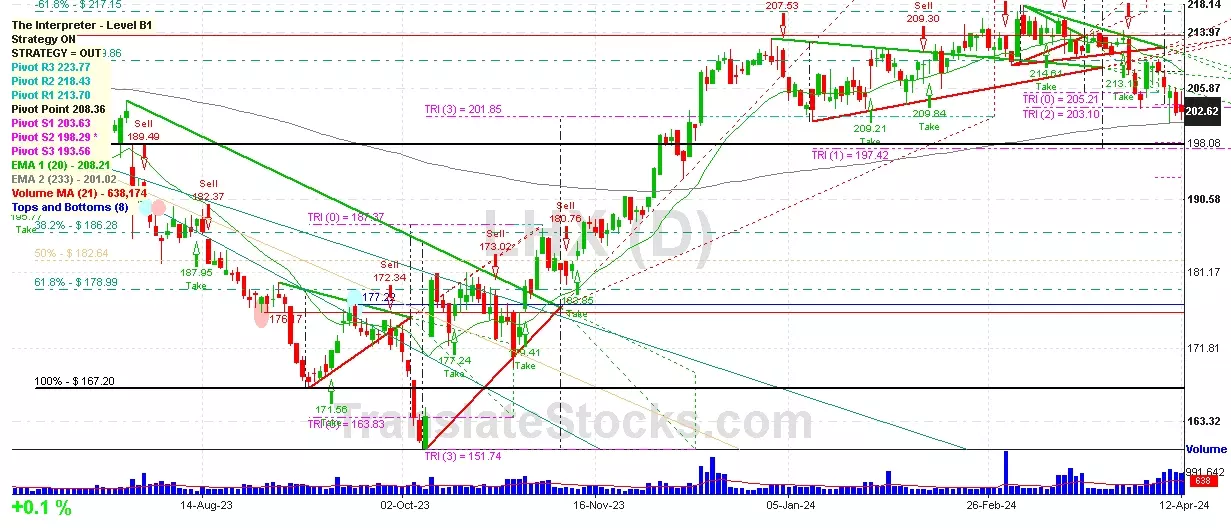
| 001 01 Apr 2024 | Sell Price: 208.56 | Profit: Open Day1 ($ 208.00) | Abandoned Baby | Sell |
| 002 22 Mar 2024 | Sell Price: 211.94 | Profit: Close Day1 ($ 211.69) | Engulfing | Sell |
| 003 14 Mar 2024 | Sell Price: 213.36 | Profit: Open Day1 ($ 211.14) | Engulfing | Sell |
| 004 11 Sep 2023 | Buy Price: 168.88 | Profit: Close Day1 ($ 169.10) | Abandoned Baby | Buy |
| 005 25 Aug 2023 | Buy Price: 178.46 | Loss: Close Day2 ($ 177.25) | Abandoned Baby | Buy |
| 006 05 May 2023 | Buy Price: 187.73 | Profit: Open Day1 ($ 188.58) | Abandoned Baby | Buy |
| 007 27 Apr 2023 | Buy Price: 198.00 | Profit: Open Day1 ($ 201.12) | Engulfing | Buy |
| 008One Year Average | Both Sides Result for 7 Signals |
Profit: $ 6.01 ($ 0.86 / Signal) |
All of Them | Buy + Sell |
| Simple Moving Averages (SMA) Period | Value $ | Signal | Exponential Moving Averages (EMA) Period | Value $ | Signal | |
|---|---|---|---|---|---|---|
| 2 | 201.74 | BUY | 2 | 201.84 | BUY | |
| 3 | 201.27 | BUY | 3 | 201.85 | BUY | |
| 5 | 201.93 | BUY | 5 | 202.26 | SELL | |
| 8 | 202.96 | SELL | 8 | 203.15 | SELL | |
| 13 | 204.63 | SELL | 13 | 204.57 | SELL | |
| 21 | 207.36 | SELL | 21 | 206.24 | SELL | |
| 34 | 209.70 | SELL | 34 | 207.59 | SELL | |
| 55 | 210.05 | SELL | 55 | 207.62 | SELL | |
| 90 | 208.73 | SELL | 90 | 205.48 | SELL | |
| 200 | 194.46 | BUY | 200 | 201.14 | BUY |
L3harris Technologies Inc
IPO: 1955-07-13
Ticker: LHXIndices: S&P 500,
Exchange: New York Stock Exchange, Inc. (US - USD)
Website: https://www.l3harris.com/
Phone:
Common Stock
Manufacturing (
Search, Detection, Navagation, Guidance, Aeronautical Sys

 Click to Enlarge