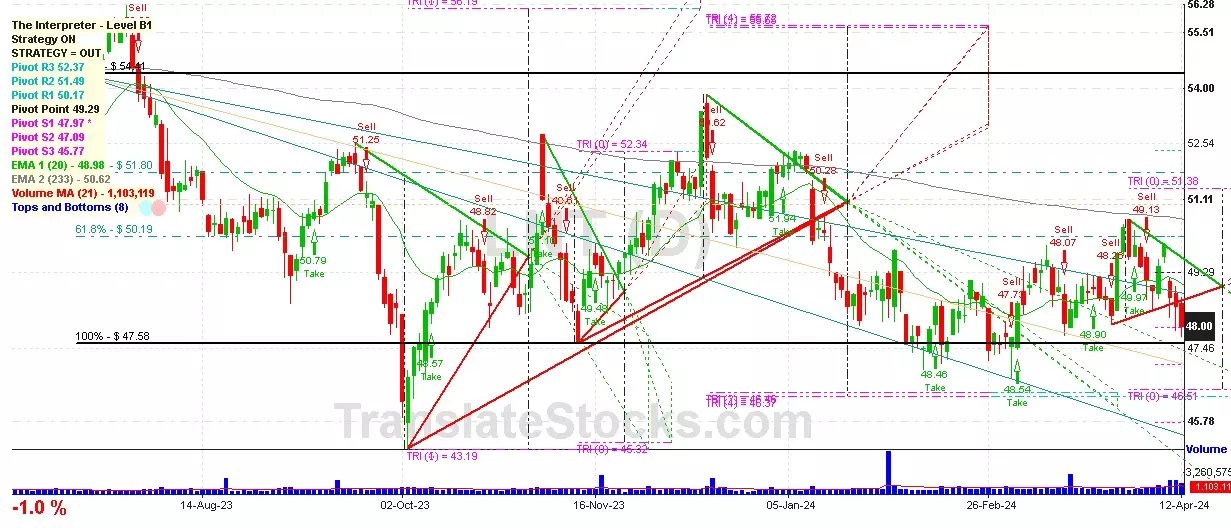
Hey Friend, I'm analysing ALLIANT ENERGY CORP (LNT), and it is between the Support of $ 47.97 (PivotS1) and the Resistance of $ 48.01 (0% of Fibonacci). The stock is also approaching the line of PivotS1 at $ 47.97, and if it goes below this line it could reach the next Support of -38.2% of Fibonacci at $ 47.27.

| Date | Price $ | Result % | Candle Name | Side |
|---|---|---|---|---|
| 001 08 Apr 2024 | Buy Price: 49.42 | Profit: Open Day1 ($ 49.68) | Abandoned Baby | Buy |
| 002 08 Apr 2024 | Buy Price: 49.45 | Profit: Open Day1 ($ 49.68) | Engulfing | Buy |
| 003 01 Apr 2024 | Sell Price: 49.68 | Profit: Close Day2 ($ 49.45) | Engulfing | Sell |
| 004 12 Mar 2024 | Sell Price: 48.77 | Profit: Close Day2 ($ 48.07) | Abandoned Baby | Sell |
| 005 23 Feb 2024 | Buy Price: 48.70 | Loss: Close Day2 ($ 47.82) | Piercing Line | Buy |
| 006 09 Feb 2024 | Buy Price: 47.97 | Profit: Open Day1 ($ 48.04) | Abandoned Baby | Buy |
| 007 09 Feb 2024 | Buy Price: 47.93 | Profit: Open Day1 ($ 48.04) | Engulfing | Buy |
| 008 30 Jan 2024 | Sell Price: 48.88 | Profit: Close Day1 ($ 48.66) | Abandoned Baby | Sell |
| 009 28 Dec 2023 | Buy Price: 51.32 | Profit: Close Day2 ($ 51.88) | Engulfing | Buy |
| 010 12 Dec 2023 | Sell Price: 51.39 | Loss: Close Day2 ($ 52.19) | Dark Cloud Cover | Sell |
| 011 05 Dec 2023 | Sell Price: 51.25 | Loss: Close Day2 ($ 51.82) | Dark Cloud Cover | Sell |
| 012 31 Oct 2023 | Buy Price: 48.79 | Profit: Open Day1 ($ 48.92) | Abandoned Baby | Buy |
| 013 12 Sep 2023 | Sell Price: 50.72 | Loss: Close Day2 ($ 52.09) | Dark Cloud Cover | Sell |
| 014 30 May 2023 | Buy Price: 51.01 | Profit: Open Day1 ($ 51.16) | Abandoned Baby | Buy |
| 015 15 May 2023 | Sell Price: 54.00 | Profit: Open Day1 ($ 53.96) | Engulfing | Sell |
| 016One Year Average | Both Sides Result for 15 Signals |
Loss: $ -0.92 ($ -0.06 / Signal) |
All of Them | Buy + Sell |
| Simple Moving Averages (SMA) Period | Value $ | Signal | Exponential Moving Averages (EMA) Period | Value $ | Signal | |
|---|---|---|---|---|---|---|
| 2 | 50.17 | BUY | 2 | 50.21 | BUY | |
| 3 | 50.08 | BUY | 3 | 50.06 | BUY | |
| 5 | 49.78 | BUY | 5 | 49.77 | BUY | |
| 8 | 49.09 | BUY | 8 | 49.49 | BUY | |
| 13 | 49.02 | BUY | 13 | 49.28 | BUY | |
| 21 | 49.18 | BUY | 21 | 49.15 | BUY | |
| 34 | 49.05 | BUY | 34 | 49.05 | BUY | |
| 55 | 48.69 | BUY | 55 | 49.07 | BUY | |
| 90 | 49.30 | BUY | 90 | 49.26 | BUY | |
| 200 | 50.10 | BUY | 200 | 50.20 | BUY |
Alliant Energy Corp
IPO: 1976-03-30
Ticker: LNTIndices: S&P 500,
Exchange: Nasdaq Nms - Global Market (US - USD)
Website: https://www.alliantenergy.com/
Phone:
Common Stock
Energy & Transportation (
Electric & Other Services Combined
 Click to Enlarge