| Date | Price $ | Result % | Candle Name | Side |
|---|---|---|---|---|
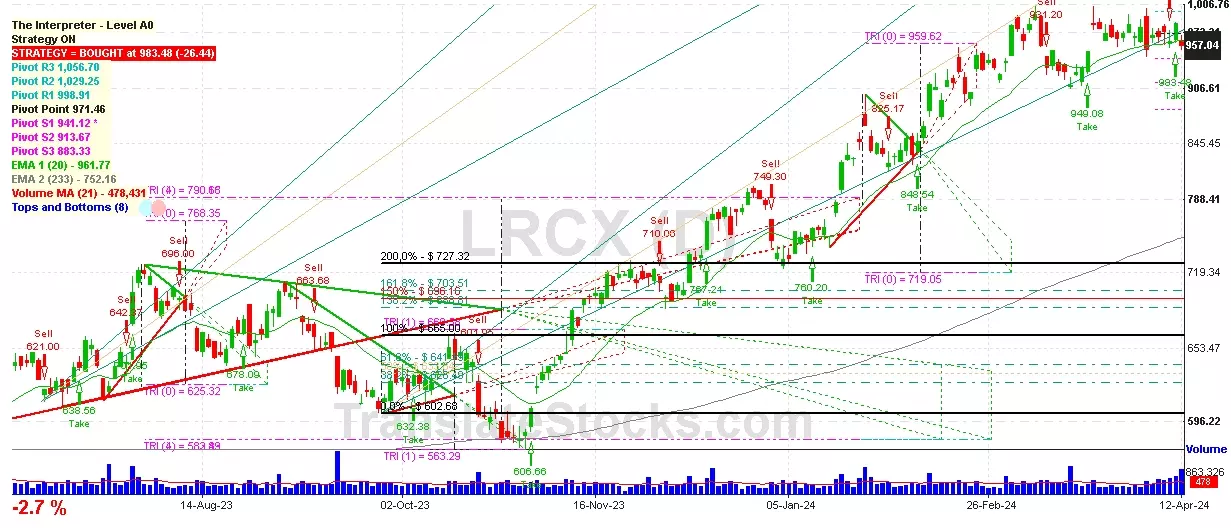
| 001 11 Apr 2024 | Buy Price: 983.48 | Loss: Close Day2 ($ 946.17) | Abandoned Baby | Buy |
| 002 11 Jan 2024 | Buy Price: 760.20 | Profit: Open Day1 ($ 760.73) | Engulfing | Buy |
| 003 18 Dec 2023 | Sell Price: 769.56 | Profit: Close Day2 ($ 754.93) | Engulfing | Sell |
| 004 18 Dec 2023 | Sell Price: 769.92 | Profit: Close Day2 ($ 754.93) | Dark Cloud Cover | Sell |
| 005 29 Nov 2023 | Buy Price: 713.99 | Profit: Open Day1 ($ 718.80) | Abandoned Baby | Buy |
| 006 31 Oct 2023 | Buy Price: 588.22 | Profit: Open Day1 ($ 592.87) | Abandoned Baby | Buy |
| 007 24 Oct 2023 | Buy Price: 604.02 | Loss: Close Day2 ($ 585.13) | Abandoned Baby | Buy |
| 008 27 Sep 2023 | Buy Price: 613.92 | Profit: Close Day1 ($ 627.52) | Abandoned Baby | Buy |
| 009 14 Sep 2023 | Sell Price: 656.43 | Profit: Open Day1 ($ 646.98) | Engulfing | Sell |
| 010 14 Sep 2023 | Sell Price: 656.39 | Profit: Open Day1 ($ 646.98) | Dark Cloud Cover | Sell |
| 011 08 Aug 2023 | Sell Price: 696.00 | Profit: Close Day1 ($ 686.05) | Abandoned Baby | Sell |
| 012 31 May 2023 | Sell Price: 616.70 | Profit: Close Day2 ($ 613.67) | Abandoned Baby | Sell |
| 013One Year Average | Both Sides Result for 12 Signals |
Profit: $ 28.85 ($ 2.40 / Signal) |
All of Them | Buy + Sell |
| Simple Moving Averages (SMA) Period | Value $ | Signal | Exponential Moving Averages (EMA) Period | Value $ | Signal | |
|---|---|---|---|---|---|---|
| 2 | 879.59 | SELL | 2 | 880.82 | SELL | |
| 3 | 890.48 | SELL | 3 | 891.34 | SELL | |
| 5 | 916.17 | SELL | 5 | 907.57 | SELL | |
| 8 | 935.37 | SELL | 8 | 922.68 | SELL | |
| 13 | 947.86 | SELL | 13 | 935.48 | SELL | |
| 21 | 957.51 | SELL | 21 | 942.35 | SELL | |
| 34 | 953.86 | SELL | 34 | 938.67 | SELL | |
| 55 | 933.74 | SELL | 55 | 918.22 | SELL | |
| 90 | 874.47 | SELL | 90 | 877.66 | SELL | |
| 200 | 754.89 | BUY | 200 | 779.65 | BUY |
Lam Research Corp
IPO: 1984-05-11
Ticker: LRCXIndices: S&P 500,
Nasdaq 100,
Exchange: Nasdaq Nms - Global Market (US - USD)
Website: http://www.lamresearch.com
Phone:
Common Stock
Technology (
Special Industry Machinery, Nec

 Click to Enlarge