| Date | Price $ | Result % | Candle Name | Side |
|---|---|---|---|---|
| 001 26 Mar 2024 | Sell Price: 28.41 | Loss: Close Day2 ($ 29.19) | Engulfing | Sell |
| 002 15 Mar 2024 | Buy Price: 28.35 | Loss: Close Day2 ($ 28.17) | Engulfing | Buy |
| 003 22 Dec 2023 | Sell Price: 29.50 | Profit: Open Day1 ($ 29.43) | Engulfing | Sell |
| 004 28 Nov 2023 | Buy Price: 24.82 | Profit: Open Day1 ($ 25.05) | Engulfing | Buy |
| 005 06 Nov 2023 | Sell Price: 23.53 | Loss: Close Day2 ($ 23.99) | Engulfing | Sell |
| 006 18 Jul 2023 | Buy Price: 36.74 | Profit: Close Day1 ($ 37.35) | Engulfing | Buy |
| 007 26 Jun 2023 | Buy Price: 34.00 | Profit: Open Day1 ($ 34.05) | Abandoned Baby | Buy |
| 008 19 May 2023 | Sell Price: 29.48 | Profit: Close Day1 ($ 29.32) | Engulfing | Sell |
| 009One Year Average | Both Sides Result for 8 Signals |
Loss: $ -0.30 ($ -0.04 / Signal) |
All of Them | Buy + Sell |
| Simple Moving Averages (SMA) Period | Value $ | Signal | Exponential Moving Averages (EMA) Period | Value $ | Signal | |
|---|---|---|---|---|---|---|
| 2 | 28.92 | BUY | 2 | 28.88 | BUY | |
| 3 | 28.63 | BUY | 3 | 28.72 | BUY | |
| 5 | 28.25 | BUY | 5 | 28.55 | BUY | |
| 8 | 28.35 | BUY | 8 | 28.46 | BUY | |
| 13 | 28.32 | BUY | 13 | 28.52 | BUY | |
| 21 | 28.51 | BUY | 21 | 28.83 | BUY | |
| 34 | 29.65 | SELL | 34 | 29.33 | SELL | |
| 55 | 30.84 | SELL | 55 | 29.67 | SELL | |
| 90 | 30.28 | SELL | 90 | 29.71 | SELL | |
| 200 | 29.71 | SELL | 200 | 30.16 | SELL |
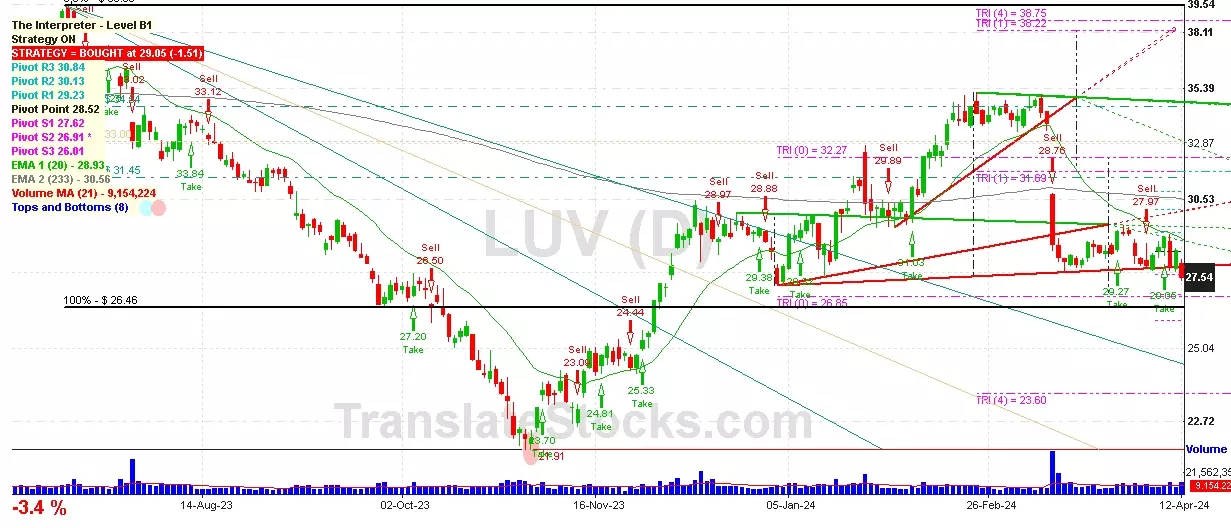
Southwest Airlines Co
IPO: 1971-06-08
Ticker: LUVIndices: S&P 500,
Exchange: New York Stock Exchange, Inc. (US - USD)
Website: https://www.southwest.com/
Phone:
Common Stock
Energy & Transportation (
Air Transportation, Scheduled

 Click to Enlarge