| Date | Price $ | Result % | Candle Name | Side |
|---|---|---|---|---|
| 001 11 Apr 2024 | Buy Price: 102.78 | Loss: Close Day2 ($ 99.77) | Abandoned Baby | Buy |
| 002 11 Apr 2024 | Buy Price: 102.74 | Loss: Close Day2 ($ 99.77) | Engulfing | Buy |
| 003 19 Mar 2024 | Sell Price: 103.82 | Loss: Close Day2 ($ 106.66) | Abandoned Baby | Sell |
| 004 19 Mar 2024 | Sell Price: 104.02 | Profit: Open Day1 ($ 103.90) | Engulfing | Sell |
| 005 02 Feb 2024 | Sell Price: 88.20 | Profit: Open Day1 ($ 87.59) | Abandoned Baby | Sell |
| 006 22 Jan 2024 | Sell Price: 89.03 | Loss: Close Day2 ($ 89.35) | Engulfing | Sell |
| 007 05 Jan 2024 | Buy Price: 89.45 | Profit: Open Day1 ($ 90.15) | Engulfing | Buy |
| 008 05 Jan 2024 | Buy Price: 89.21 | Profit: Open Day1 ($ 90.15) | Piercing Line | Buy |
| 009 22 Dec 2023 | Buy Price: 91.43 | Profit: Open Day1 ($ 91.50) | Piercing Line | Buy |
| 010 12 Oct 2023 | Sell Price: 86.24 | Profit: Open Day1 ($ 86.14) | Engulfing | Sell |
| 011 01 Sep 2023 | Sell Price: 84.05 | Profit: Open Day1 ($ 83.46) | Engulfing | Sell |
| 012 29 Aug 2023 | Sell Price: 84.28 | Loss: Close Day2 ($ 84.53) | Abandoned Baby | Sell |
| 013 07 Jul 2023 | Buy Price: 91.76 | Profit: Close Day1 ($ 92.03) | Piercing Line | Buy |
| 014 27 Jun 2023 | Buy Price: 88.07 | Profit: Open Day1 ($ 88.24) | Abandoned Baby | Buy |
| 015 22 Jun 2023 | Buy Price: 88.88 | Loss: Close Day2 ($ 87.30) | Engulfing | Buy |
| 016 22 Jun 2023 | Buy Price: 88.80 | Loss: Close Day2 ($ 87.30) | Piercing Line | Buy |
| 017 01 Jun 2023 | Buy Price: 81.13 | Profit: Open Day1 ($ 82.17) | Abandoned Baby | Buy |
| 018 01 Jun 2023 | Buy Price: 81.33 | Profit: Open Day1 ($ 82.17) | Engulfing | Buy |
| 019 11 May 2023 | Sell Price: 77.76 | Loss: Close Day2 ($ 80.39) | Abandoned Baby | Sell |
| 020One Year Average | Both Sides Result for 19 Signals |
Loss: $ -9.65 ($ -0.51 / Signal) |
All of Them | Buy + Sell |
| Simple Moving Averages (SMA) Period | Value $ | Signal | Exponential Moving Averages (EMA) Period | Value $ | Signal | |
|---|---|---|---|---|---|---|
| 2 | 89.87 | SELL | 2 | 89.68 | SELL | |
| 3 | 89.40 | BUY | 3 | 89.77 | SELL | |
| 5 | 89.56 | BUY | 5 | 90.45 | SELL | |
| 8 | 91.45 | SELL | 8 | 91.98 | SELL | |
| 13 | 95.56 | SELL | 13 | 94.25 | SELL | |
| 21 | 98.98 | SELL | 21 | 96.37 | SELL | |
| 34 | 100.70 | SELL | 34 | 97.39 | SELL | |
| 55 | 97.71 | SELL | 55 | 96.90 | SELL | |
| 90 | 94.99 | SELL | 90 | 95.11 | SELL | |
| 200 | 89.90 | SELL | 200 | 90.83 | SELL |
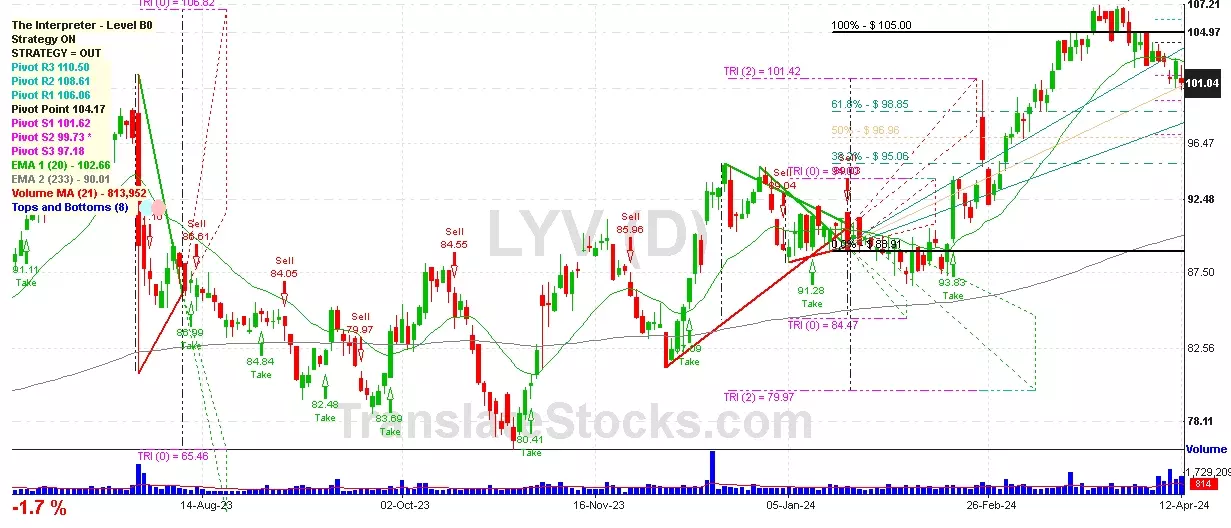
Live Nation Entertainment In
IPO: 2005-12-14
Ticker: LYVIndices: S&P 500,
Exchange: New York Stock Exchange, Inc. (US - USD)
Website: http://www.livenationentertainment.com/
Phone:
Common Stock
Trade & Services (
Services-amusement & Recreation Services

 Click to Enlarge