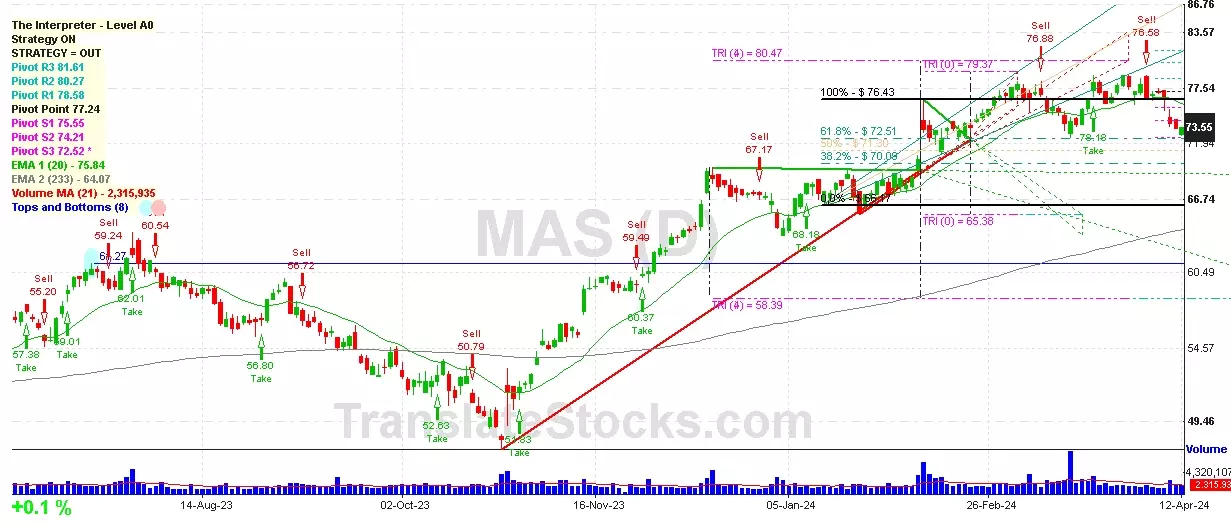
Hey Friend, I'm analysing MASCO CORP (MAS), and it is between the Support of $ 73.07 (161.8% of Fibonacci) and the Resistance of $ 74.21 (PivotS2). The stock is also approaching the line of PivotS2 at $ 74.21, and if it goes above this line it could reach the next Resistance of 200% of Fibonacci at $ 75.30.

| Date | Price $ | Result % | Candle Name | Side |
|---|---|---|---|---|
| 001 14 Feb 2024 | Buy Price: 73.47 | Profit: Open Day1 ($ 74.12) | Abandoned Baby | Buy |
| 002 23 Jan 2024 | Sell Price: 67.03 | Profit: Close Day1 ($ 65.47) | Abandoned Baby | Sell |
| 003 16 Oct 2023 | Buy Price: 52.52 | Profit: Close Day1 ($ 52.55) | Abandoned Baby | Buy |
| 004 27 Sep 2023 | Buy Price: 53.21 | Profit: Open Day1 ($ 53.29) | Abandoned Baby | Buy |
| 005 11 Sep 2023 | Buy Price: 56.64 | Loss: Close Day2 ($ 55.48) | Abandoned Baby | Buy |
| 006 05 Sep 2023 | Sell Price: 57.28 | Profit: Open Day1 ($ 57.13) | Abandoned Baby | Sell |
| 007 20 Jun 2023 | Buy Price: 56.01 | Profit: Close Day1 ($ 56.17) | Piercing Line | Buy |
| 008 30 May 2023 | Sell Price: 49.99 | Profit: Open Day1 ($ 49.84) | Engulfing | Sell |
| 009 26 May 2023 | Buy Price: 50.77 | Profit: Open Day1 ($ 50.84) | Abandoned Baby | Buy |
| 010One Year Average | Both Sides Result for 9 Signals |
Profit: $ 1.69 ($ 0.19 / Signal) |
All of Them | Buy + Sell |
| Simple Moving Averages (SMA) Period | Value $ | Signal | Exponential Moving Averages (EMA) Period | Value $ | Signal | |
|---|---|---|---|---|---|---|
| 2 | 72.07 | SELL | 2 | 72.05 | SELL | |
| 3 | 72.16 | SELL | 3 | 72.19 | SELL | |
| 5 | 72.42 | SELL | 5 | 72.54 | SELL | |
| 8 | 72.89 | SELL | 8 | 73.13 | SELL | |
| 13 | 74.49 | SELL | 13 | 73.90 | SELL | |
| 21 | 75.61 | SELL | 21 | 74.52 | SELL | |
| 34 | 75.65 | SELL | 34 | 74.57 | SELL | |
| 55 | 74.70 | SELL | 55 | 73.57 | SELL | |
| 90 | 71.74 | BUY | 90 | 71.21 | BUY | |
| 200 | 63.47 | BUY | 200 | 65.51 | BUY |
Masco Corp
IPO: 1969-05-05
Ticker: MASIndices: S&P 500,
Exchange: New York Stock Exchange, Inc. (US - USD)
Website: https://masco.com/
Phone:
Common Stock
Manufacturing (
Heating Equip, Except Elec & Warm Air; & Plumbing Fixtures
 Click to Enlarge