| Date | Price $ | Result % | Candle Name | Side |
|---|---|---|---|---|
| 001 11 Apr 2024 | Sell Price: 523.37 | Profit: Open Day1 ($ 521.50) | Engulfing | Sell |
| 002 04 Apr 2024 | Sell Price: 534.79 | Profit: Close Day2 ($ 532.23) | Engulfing | Sell |
| 003 03 Apr 2024 | Buy Price: 540.09 | Profit: Open Day1 ($ 542.65) | Abandoned Baby | Buy |
| 004 13 Mar 2024 | Sell Price: 520.21 | Loss: Close Day2 ($ 533.64) | Engulfing | Sell |
| 005 05 Mar 2024 | Sell Price: 528.83 | Profit: Close Day1 ($ 525.05) | Dark Cloud Cover | Sell |
| 006 27 Feb 2024 | Sell Price: 518.98 | Loss: Close Day2 ($ 521.41) | Abandoned Baby | Sell |
| 007 06 Feb 2024 | Sell Price: 506.87 | Profit: Open Day2 ($ 505.01) | Engulfing | Sell |
| 008 17 Jan 2024 | Sell Price: 485.82 | Profit: Open Day1 ($ 483.83) | Engulfing | Sell |
| 009 15 Sep 2023 | Buy Price: 420.34 | Profit: Open Day1 ($ 422.15) | Engulfing | Buy |
| 010 15 Sep 2023 | Buy Price: 420.13 | Profit: Open Day1 ($ 422.15) | Piercing Line | Buy |
| 011 21 Jul 2023 | Sell Price: 414.25 | Profit: Open Day1 ($ 414.19) | Engulfing | Sell |
| 012 23 Jun 2023 | Sell Price: 415.58 | Profit: Close Day1 ($ 414.09) | Engulfing | Sell |
| 013 23 Jun 2023 | Sell Price: 415.76 | Profit: Close Day1 ($ 414.09) | Dark Cloud Cover | Sell |
| 014 08 Jun 2023 | Buy Price: 389.22 | Profit: Close Day1 ($ 393.91) | Engulfing | Buy |
| 015 01 May 2023 | Sell Price: 354.01 | Profit: Open Day1 ($ 353.25) | Engulfing | Sell |
| 016One Year Average | Both Sides Result for 15 Signals |
Profit: $ 11.26 ($ 0.75 / Signal) |
All of Them | Buy + Sell |
| Simple Moving Averages (SMA) Period | Value $ | Signal | Exponential Moving Averages (EMA) Period | Value $ | Signal | |
|---|---|---|---|---|---|---|
| 2 | 522.37 | SELL | 2 | 521.25 | SELL | |
| 3 | 524.36 | SELL | 3 | 522.41 | SELL | |
| 5 | 523.75 | SELL | 5 | 523.80 | SELL | |
| 8 | 524.93 | SELL | 8 | 525.45 | SELL | |
| 13 | 529.12 | SELL | 13 | 527.27 | SELL | |
| 21 | 531.30 | SELL | 21 | 527.98 | SELL | |
| 34 | 530.36 | SELL | 34 | 525.68 | SELL | |
| 55 | 521.95 | SELL | 55 | 518.60 | BUY | |
| 90 | 502.14 | BUY | 90 | 505.60 | BUY | |
| 200 | 465.82 | BUY | 200 | 471.36 | BUY |
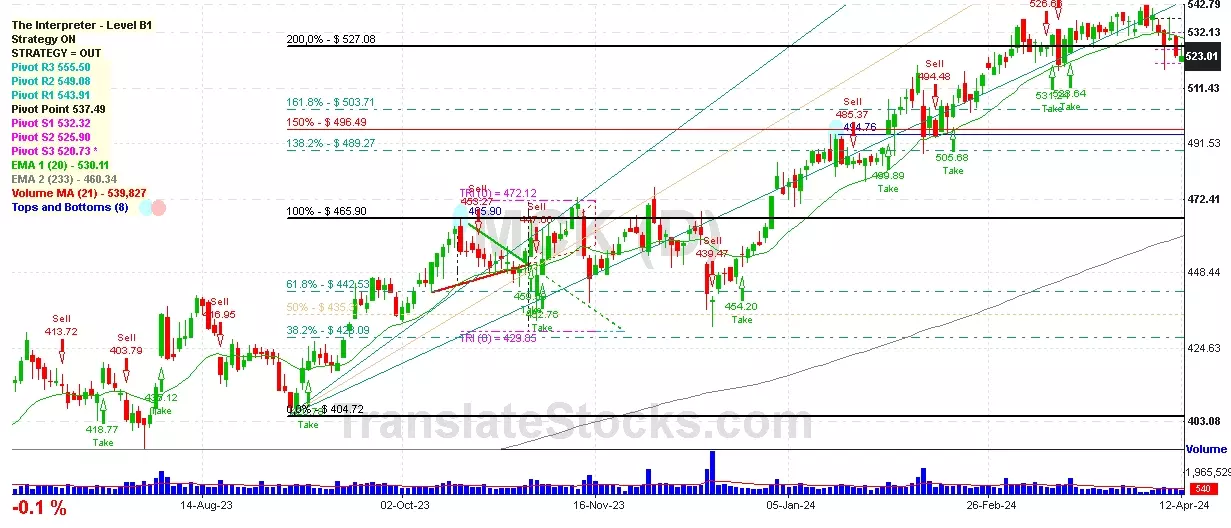
Mckesson Corp
IPO: 1994-11-10
Ticker: MCKIndices: S&P 500,
Exchange: New York Stock Exchange, Inc. (US - USD)
Website: http://www.mckesson.com
Phone:
Common Stock
Trade & Services (
Wholesale-drugs, Proprietaries & Druggists' Sundries

 Click to Enlarge