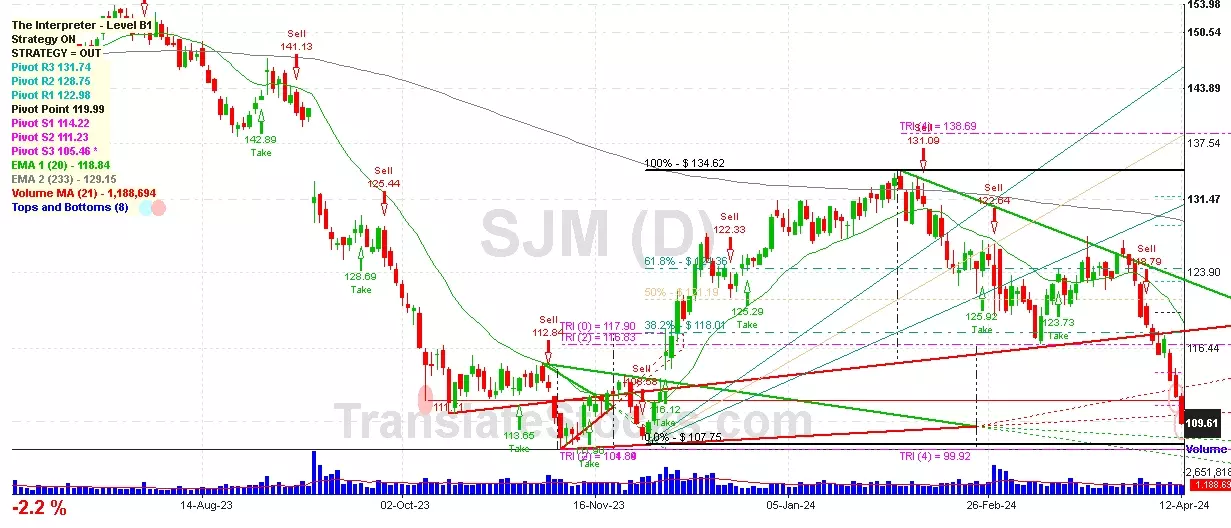
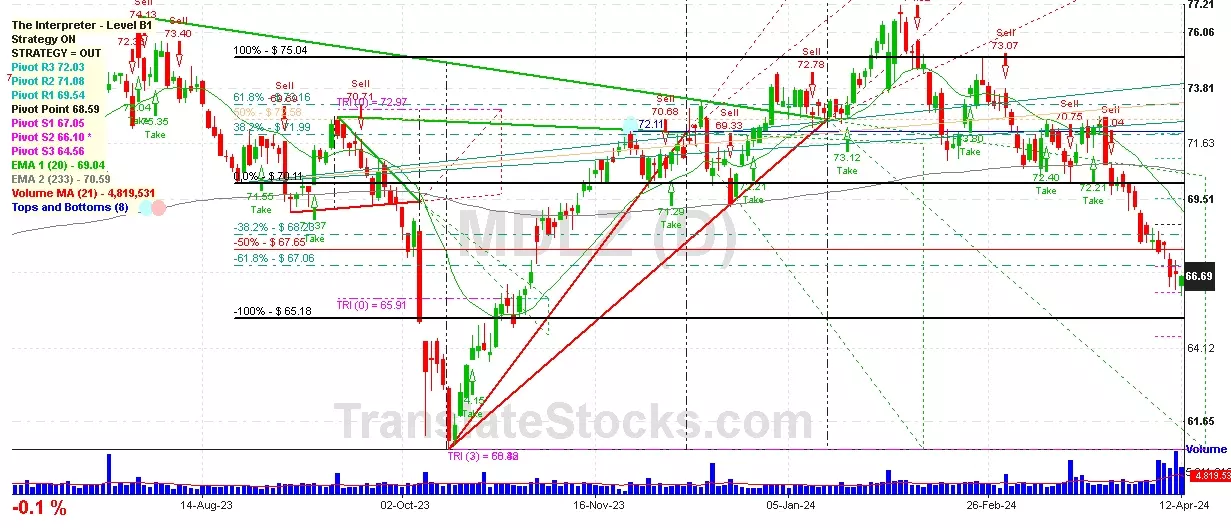
Hey Friend, I'm analysing MONDELEZ INTERNATIONAL INC A (MDLZ), and it is between the Support of $ 66.10 (PivotS2) and the Resistance of $ 67.05 (PivotS1). The stock is also approaching the line of PivotS1 at $ 67.05, and if it goes above this line it could reach the next Resistance of -61.8% of Fibonacci at $ 67.06.

| Date | Price $ | Result % | Candle Name | Side |
|---|---|---|---|---|
| 001 20 Nov 2023 | Buy Price: 70.91 | Profit: Open Day1 ($ 71.00) | Piercing Line | Buy |
| 002 20 Oct 2023 | Sell Price: 64.10 | Profit: Open Day1 ($ 63.92) | Engulfing | Sell |
| 003 20 Oct 2023 | Sell Price: 64.10 | Profit: Open Day1 ($ 63.92) | Dark Cloud Cover | Sell |
| 004 28 Jul 2023 | Buy Price: 75.04 | Loss: Close Day2 ($ 74.35) | Abandoned Baby | Buy |
| 005 12 May 2023 | Sell Price: 77.88 | Profit: Close Day1 ($ 77.73) | Engulfing | Sell |
| 006One Year Average | Both Sides Result for 5 Signals |
Loss: $ -0.09 ($ -0.02 / Signal) |
All of Them | Buy + Sell |
| Simple Moving Averages (SMA) Period | Value $ | Signal | Exponential Moving Averages (EMA) Period | Value $ | Signal | |
|---|---|---|---|---|---|---|
| 2 | 67.64 | BUY | 2 | 67.71 | BUY | |
| 3 | 67.26 | BUY | 3 | 67.43 | BUY | |
| 5 | 66.73 | BUY | 5 | 67.18 | BUY | |
| 8 | 66.72 | BUY | 8 | 67.18 | BUY | |
| 13 | 67.19 | BUY | 13 | 67.54 | BUY | |
| 21 | 68.48 | SELL | 21 | 68.26 | SELL | |
| 34 | 69.64 | SELL | 34 | 69.22 | SELL | |
| 55 | 71.18 | SELL | 55 | 70.11 | SELL | |
| 90 | 71.84 | SELL | 90 | 70.66 | SELL | |
| 200 | 70.88 | SELL | 200 | 70.61 | SELL |
Mondelez International Inc-a
IPO: 2001-06-13
Ticker: MDLZIndices: S&P 500,
Nasdaq 100,
Exchange: Nasdaq Nms - Global Market (US - USD)
Website: https://www.mondelezinternational.com/
Phone:
Common Stock
Manufacturing (
Food And Kindred Products
 Click to Enlarge