| Date | Price $ | Result % | Candle Name | Side |
|---|---|---|---|---|
| 001 01 Apr 2024 | Sell Price: 87.02 | Profit: Open Day1 ($ 86.86) | Abandoned Baby | Sell |
| 002 13 Mar 2024 | Sell Price: 85.08 | Profit: Open Day1 ($ 84.52) | Engulfing | Sell |
| 003 18 Jan 2024 | Buy Price: 86.29 | Profit: Close Day1 ($ 86.49) | Abandoned Baby | Buy |
| 004 18 May 2023 | Buy Price: 89.13 | Profit: Open Day1 ($ 89.19) | Engulfing | Buy |
| 005 18 May 2023 | Buy Price: 89.02 | Profit: Open Day1 ($ 89.19) | Piercing Line | Buy |
| 006One Year Average | Both Sides Result for 5 Signals |
Profit: $ 1.15 ($ 0.23 / Signal) |
All of Them | Buy + Sell |
| Simple Moving Averages (SMA) Period | Value $ | Signal | Exponential Moving Averages (EMA) Period | Value $ | Signal | |
|---|---|---|---|---|---|---|
| 2 | 79.17 | SELL | 2 | 79.27 | SELL | |
| 3 | 79.52 | SELL | 3 | 79.55 | SELL | |
| 5 | 80.17 | SELL | 5 | 80.18 | SELL | |
| 8 | 81.24 | SELL | 8 | 80.99 | SELL | |
| 13 | 82.74 | SELL | 13 | 81.91 | SELL | |
| 21 | 83.39 | SELL | 21 | 82.73 | SELL | |
| 34 | 83.87 | SELL | 34 | 83.37 | SELL | |
| 55 | 84.54 | SELL | 55 | 83.60 | SELL | |
| 90 | 84.31 | SELL | 90 | 83.29 | SELL | |
| 200 | 81.78 | SELL | 200 | 82.93 | SELL |
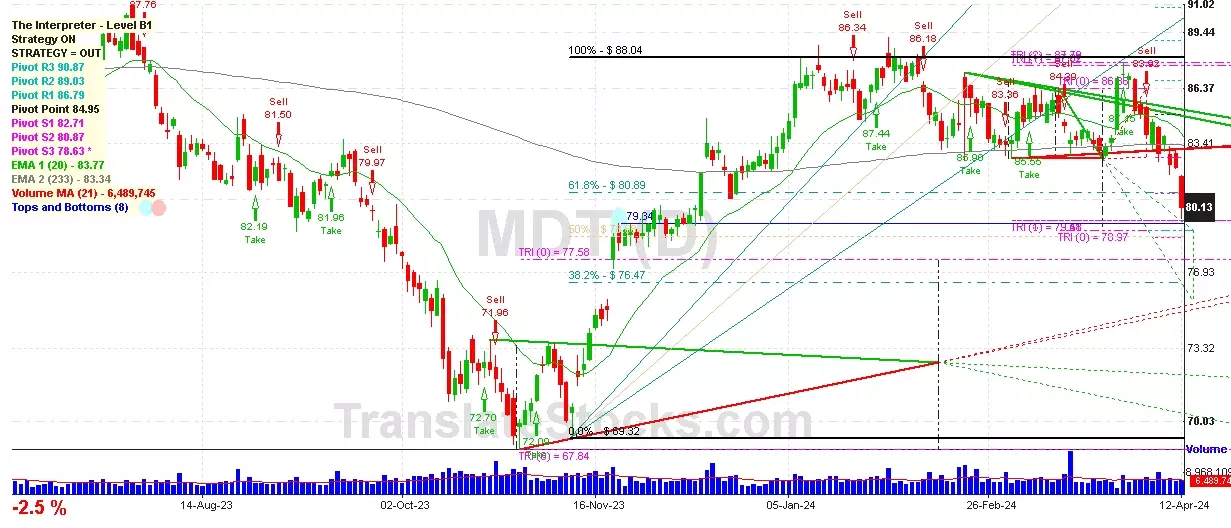
Medtronic Plc
IPO: 1980-03-17
Ticker: MDTIndices: S&P 500,
Exchange: New York Stock Exchange, Inc. (IE - USD)
Website: http://www.medtronic.com/
Phone:
Common Stock
Life Sciences (
Electromedical & Electrotherapeutic Apparatus

 Click to Enlarge