| Date | Price $ | Result % | Candle Name | Side |
|---|---|---|---|---|
| 001 03 Apr 2024 | Buy Price: 126.59 | Profit: Open Day1 ($ 128.08) | Engulfing | Buy |
| 002 03 Apr 2024 | Buy Price: 126.42 | Profit: Open Day1 ($ 128.08) | Piercing Line | Buy |
| 003 26 Mar 2024 | Sell Price: 125.10 | Loss: Close Day2 ($ 130.89) | Engulfing | Sell |
| 004 26 Mar 2024 | Sell Price: 125.45 | Loss: Close Day2 ($ 130.89) | Dark Cloud Cover | Sell |
| 005 11 Mar 2024 | Sell Price: 120.34 | Profit: Close Day1 ($ 119.65) | Abandoned Baby | Sell |
| 006 06 Feb 2024 | Buy Price: 106.81 | Profit: Open Day1 ($ 107.83) | Piercing Line | Buy |
| 007 05 Jan 2024 | Buy Price: 103.88 | Profit: Open Day1 ($ 104.02) | Engulfing | Buy |
| 008 13 Dec 2023 | Buy Price: 97.58 | Profit: Open Day1 ($ 99.58) | Abandoned Baby | Buy |
| 009 14 Nov 2023 | Buy Price: 86.73 | Loss: Close Day2 ($ 85.49) | Abandoned Baby | Buy |
| 010 05 Sep 2023 | Sell Price: 97.34 | Profit: Close Day1 ($ 96.22) | Abandoned Baby | Sell |
| 011 28 Aug 2023 | Buy Price: 98.11 | Profit: Open Day1 ($ 98.22) | Abandoned Baby | Buy |
| 012 27 Jul 2023 | Sell Price: 115.01 | Profit: Open Day1 ($ 113.20) | Dark Cloud Cover | Sell |
| 013 20 Jul 2023 | Sell Price: 110.38 | Profit: Close Day1 ($ 110.29) | Abandoned Baby | Sell |
| 014One Year Average | Both Sides Result for 13 Signals |
Loss: $ -2.34 ($ -0.18 / Signal) |
All of Them | Buy + Sell |
| Simple Moving Averages (SMA) Period | Value $ | Signal | Exponential Moving Averages (EMA) Period | Value $ | Signal | |
|---|---|---|---|---|---|---|
| 2 | 111.65 | BUY | 2 | 112.07 | BUY | |
| 3 | 110.72 | BUY | 3 | 111.40 | BUY | |
| 5 | 109.70 | BUY | 5 | 111.16 | BUY | |
| 8 | 110.36 | BUY | 8 | 112.05 | BUY | |
| 13 | 114.70 | SELL | 13 | 114.01 | SELL | |
| 21 | 119.23 | SELL | 21 | 116.01 | SELL | |
| 34 | 119.95 | SELL | 34 | 116.79 | SELL | |
| 55 | 117.87 | SELL | 55 | 115.37 | SELL | |
| 90 | 112.06 | BUY | 90 | 111.79 | BUY | |
| 200 | 101.50 | BUY | 200 | 106.27 | BUY |
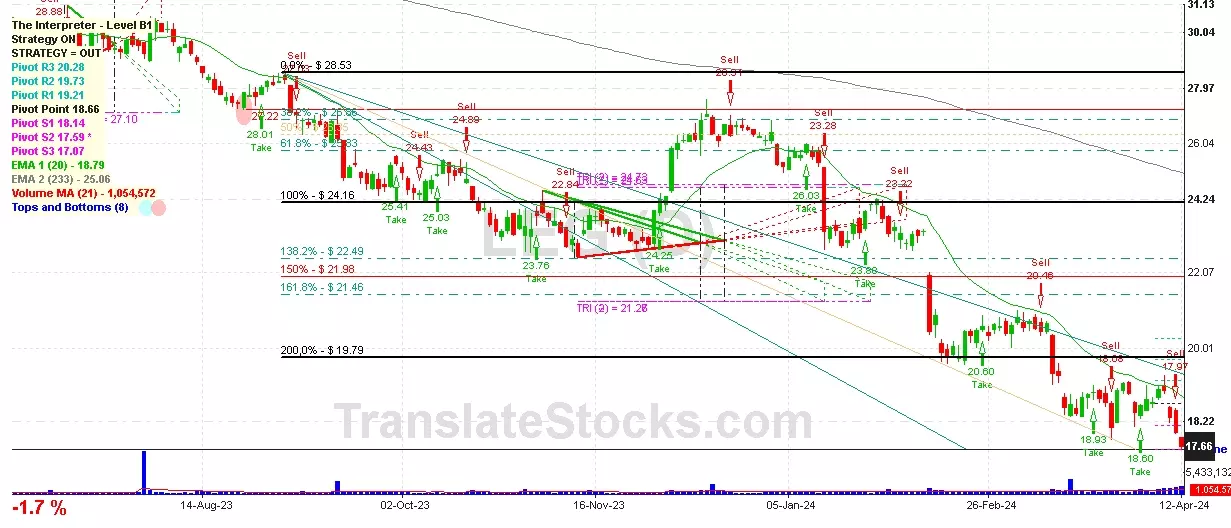
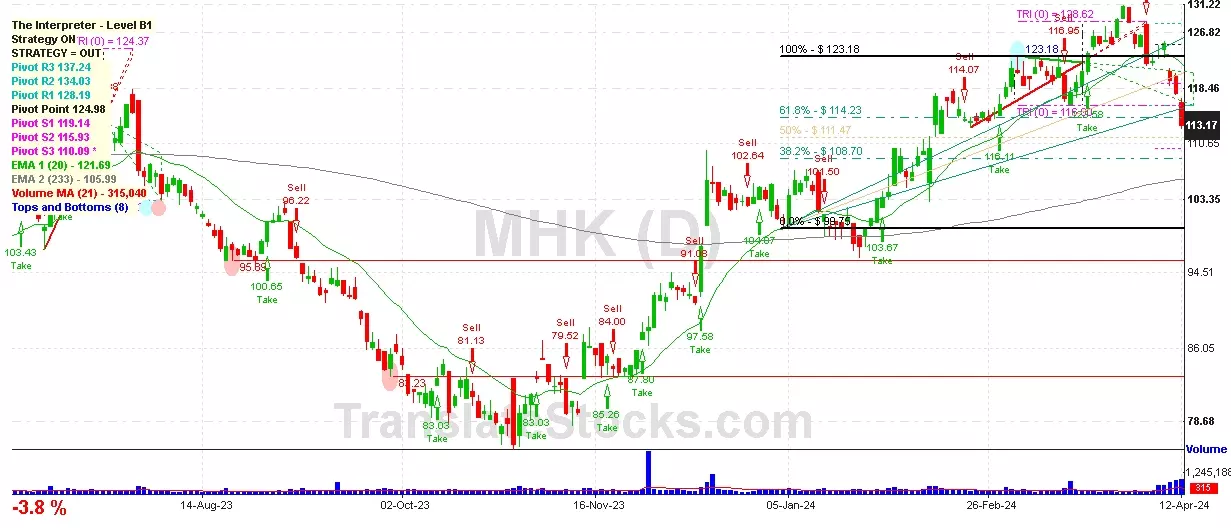
Mohawk Industries Inc
IPO: 1997-12-16
Ticker: MHKIndices: S&P 500,
Exchange: New York Stock Exchange, Inc. (US - USD)
Website: http://www.mohawkind.com
Phone:
Common Stock
Manufacturing (
Carpets & Rugs

 Click to Enlarge