| Date | Price $ | Result % | Candle Name | Side |
|---|---|---|---|---|
| 001 03 Apr 2024 | Buy Price: 203.50 | Profit: Open Day1 ($ 204.72) | Piercing Line | Buy |
| 002 01 Apr 2024 | Sell Price: 203.89 | Profit: Close Day1 ($ 203.08) | Abandoned Baby | Sell |
| 003 14 Mar 2024 | Sell Price: 207.74 | Profit: Open Day1 ($ 205.80) | Dark Cloud Cover | Sell |
| 004 12 Feb 2024 | Sell Price: 196.19 | Loss: Close Day2 ($ 197.72) | Engulfing | Sell |
| 005 26 Jan 2024 | Buy Price: 192.99 | Profit: Close Day2 ($ 193.03) | Engulfing | Buy |
| 006 04 Oct 2023 | Buy Price: 191.12 | Profit: Close Day1 ($ 191.92) | Abandoned Baby | Buy |
| 007 29 Sep 2023 | Sell Price: 190.30 | Profit: Open Day1 ($ 189.41) | Engulfing | Sell |
| 008 20 Sep 2023 | Sell Price: 197.47 | Profit: Open Day1 ($ 197.04) | Engulfing | Sell |
| 009 04 Aug 2023 | Sell Price: 189.59 | Profit: Close Day2 ($ 189.41) | Engulfing | Sell |
| 010 03 Jul 2023 | Sell Price: 185.42 | Profit: Open Day1 ($ 184.68) | Abandoned Baby | Sell |
| 011 20 Jun 2023 | Sell Price: 181.05 | Profit: Open Day1 ($ 180.68) | Abandoned Baby | Sell |
| 012 13 Jun 2023 | Sell Price: 177.37 | Loss: Close Day2 ($ 180.53) | Abandoned Baby | Sell |
| 013 08 Jun 2023 | Buy Price: 176.31 | Profit: Close Day1 ($ 178.25) | Abandoned Baby | Buy |
| 014 09 May 2023 | Sell Price: 179.38 | Loss: Close Day2 ($ 180.37) | Engulfing | Sell |
| 015One Year Average | Both Sides Result for 14 Signals |
Profit: $ 3.68 ($ 0.26 / Signal) |
All of Them | Buy + Sell |
| Simple Moving Averages (SMA) Period | Value $ | Signal | Exponential Moving Averages (EMA) Period | Value $ | Signal | |
|---|---|---|---|---|---|---|
| 2 | 201.33 | SELL | 2 | 201.18 | SELL | |
| 3 | 201.36 | SELL | 3 | 201.21 | SELL | |
| 5 | 201.65 | SELL | 5 | 201.02 | SELL | |
| 8 | 199.93 | BUY | 8 | 200.86 | BUY | |
| 13 | 200.50 | BUY | 13 | 201.05 | SELL | |
| 21 | 201.82 | SELL | 21 | 201.53 | SELL | |
| 34 | 203.41 | SELL | 34 | 201.73 | SELL | |
| 55 | 202.29 | SELL | 55 | 201.13 | SELL | |
| 90 | 198.34 | BUY | 90 | 199.59 | BUY | |
| 200 | 195.51 | BUY | 200 | 194.11 | BUY |
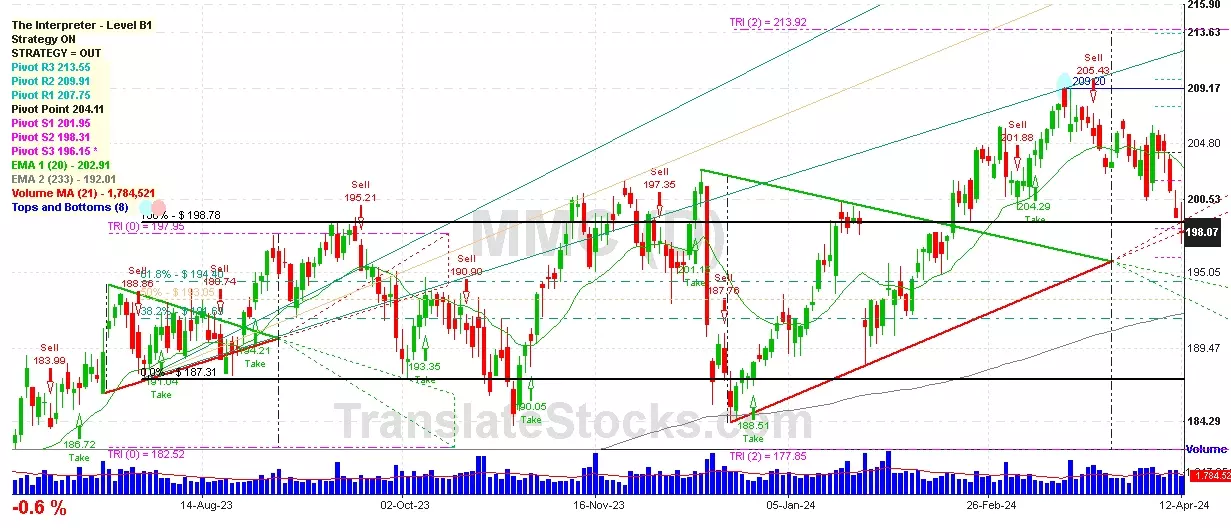
Marsh & Mclennan Cos
IPO: 1969-06-04
Ticker: MMCIndices: S&P 500,
Exchange: New York Stock Exchange, Inc. (US - USD)
Website: https://www.mmc.com/
Phone:
Common Stock
Finance (
Insurance Agents, Brokers & Service

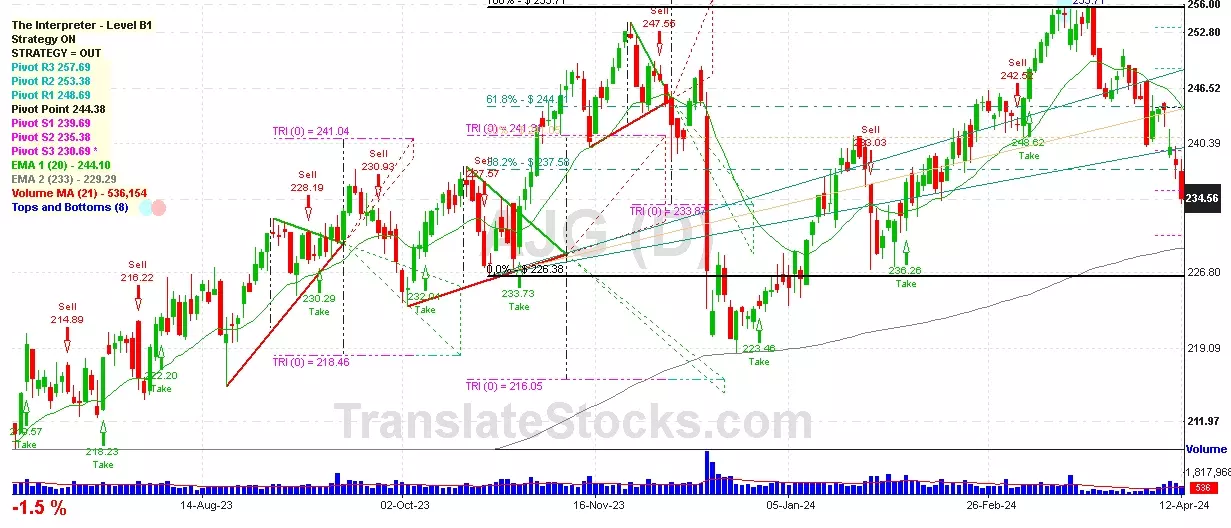
 Click to Enlarge