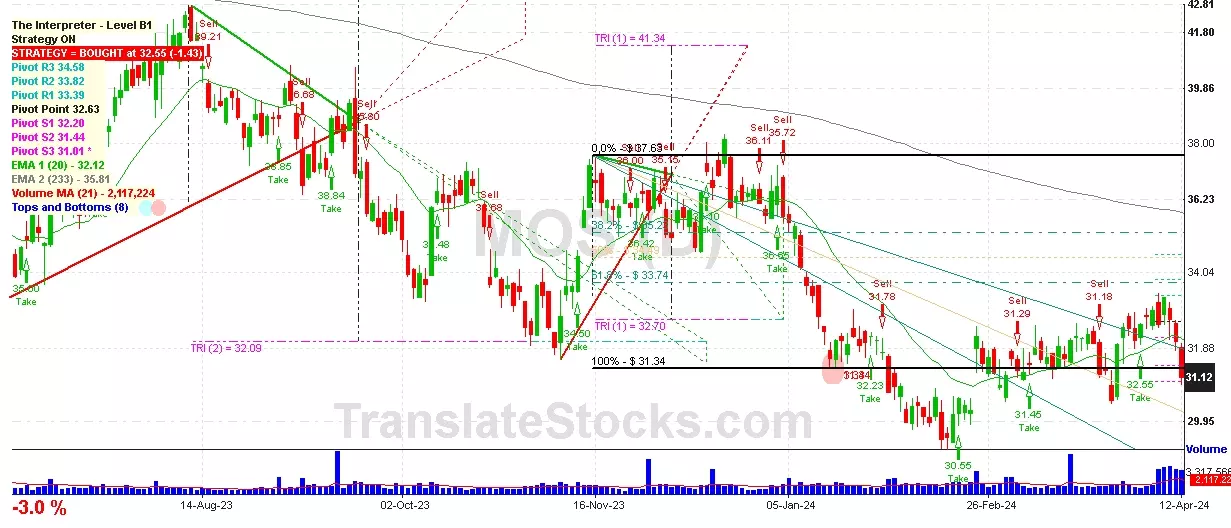
Hey Friend, I'm analysing MOSAIC CO/THE (MOS), and it is between the Support of $ 31.01 (PivotS3) and the Resistance of $ 31.34 (100% of Fibonacci). The stock is also approaching the line of PivotS3 at $ 31.01, and if it goes below this line it could reach the next Support of 200% of Fibonacci at $ 25.05.

| Date | Price $ | Result % | Candle Name | Side |
|---|---|---|---|---|
| 001 19 Mar 2024 | Sell Price: 32.16 | Profit: Open Day1 ($ 32.03) | Abandoned Baby | Sell |
| 002 15 Mar 2024 | Buy Price: 32.10 | Profit: Open Day1 ($ 32.19) | Engulfing | Buy |
| 003 06 Mar 2024 | Buy Price: 31.45 | Profit: Open Day1 ($ 31.73) | Abandoned Baby | Buy |
| 004 23 Feb 2024 | Sell Price: 31.48 | Profit: Open Day1 ($ 31.27) | Abandoned Baby | Sell |
| 005 24 Jan 2024 | Sell Price: 31.96 | Loss: Close Day2 ($ 32.23) | Abandoned Baby | Sell |
| 006 02 Jan 2024 | Buy Price: 36.48 | Profit: Close Day1 ($ 36.65) | Engulfing | Buy |
| 007 08 Nov 2023 | Buy Price: 32.77 | Profit: Open Day1 ($ 33.28) | Engulfing | Buy |
| 008 02 Nov 2023 | Buy Price: 33.66 | Loss: Close Day2 ($ 32.48) | Engulfing | Buy |
| 009 24 Aug 2023 | Buy Price: 38.56 | Profit: Open Day1 ($ 38.77) | Engulfing | Buy |
| 010 24 Aug 2023 | Buy Price: 38.54 | Profit: Open Day1 ($ 38.77) | Piercing Line | Buy |
| 011 02 Aug 2023 | Buy Price: 40.98 | Profit: Close Day2 ($ 41.24) | Engulfing | Buy |
| 012 02 Aug 2023 | Buy Price: 40.73 | Profit: Close Day1 ($ 40.80) | Piercing Line | Buy |
| 013One Year Average | Both Sides Result for 12 Signals |
Profit: $ 0.72 ($ 0.06 / Signal) |
All of Them | Buy + Sell |
| Simple Moving Averages (SMA) Period | Value $ | Signal | Exponential Moving Averages (EMA) Period | Value $ | Signal | |
|---|---|---|---|---|---|---|
| 2 | 30.38 | BUY | 2 | 30.45 | BUY | |
| 3 | 30.39 | BUY | 3 | 30.53 | SELL | |
| 5 | 30.65 | SELL | 5 | 30.79 | SELL | |
| 8 | 31.42 | SELL | 8 | 31.12 | SELL | |
| 13 | 31.87 | SELL | 13 | 31.42 | SELL | |
| 21 | 31.83 | SELL | 21 | 31.60 | SELL | |
| 34 | 31.78 | SELL | 34 | 31.70 | SELL | |
| 55 | 31.33 | SELL | 55 | 31.95 | SELL | |
| 90 | 32.61 | SELL | 90 | 32.58 | SELL | |
| 200 | 34.98 | SELL | 200 | 35.00 | SELL |
Mosaic Co/the
IPO: 2011-05-20
Ticker: MOSIndices: S&P 500,
Exchange: New York Stock Exchange, Inc. (US - USD)
Website: http://www.mosaicco.com
Phone:
Common Stock
Life Sciences (
Agricultural Chemicals
 Click to Enlarge