| Date | Price $ | Result % | Candle Name | Side |
|---|---|---|---|---|
| 001 10 Apr 2024 | Sell Price: 666.49 | Profit: Open Day2 ($ 665.88) | Abandoned Baby | Sell |
| 002 12 Feb 2024 | Sell Price: 729.87 | Profit: Open Day1 ($ 703.00) | Engulfing | Sell |
| 003 16 Jan 2024 | Buy Price: 596.41 | Profit: Open Day2 ($ 598.67) | Engulfing | Buy |
| 004 16 Nov 2023 | Sell Price: 536.98 | Loss: Close Day2 ($ 551.20) | Abandoned Baby | Sell |
| 005 28 Sep 2023 | Buy Price: 451.92 | Profit: Open Day1 ($ 460.05) | Engulfing | Buy |
| 006 14 Sep 2023 | Buy Price: 479.17 | Loss: Close Day2 ($ 463.19) | Abandoned Baby | Buy |
| 007 06 Jun 2023 | Buy Price: 497.41 | Profit: Open Day1 ($ 501.60) | Engulfing | Buy |
| 008One Year Average | Both Sides Result for 7 Signals |
Profit: $ 11.86 ($ 1.69 / Signal) |
All of Them | Buy + Sell |
| Simple Moving Averages (SMA) Period | Value $ | Signal | Exponential Moving Averages (EMA) Period | Value $ | Signal | |
|---|---|---|---|---|---|---|
| 2 | 629.02 | SELL | 2 | 627.99 | SELL | |
| 3 | 637.85 | SELL | 3 | 633.68 | SELL | |
| 5 | 643.68 | SELL | 5 | 641.53 | SELL | |
| 8 | 656.43 | SELL | 8 | 648.37 | SELL | |
| 13 | 656.08 | SELL | 13 | 655.21 | SELL | |
| 21 | 661.83 | SELL | 21 | 663.02 | SELL | |
| 34 | 682.21 | SELL | 34 | 669.01 | SELL | |
| 55 | 688.50 | SELL | 55 | 665.41 | SELL | |
| 90 | 658.00 | SELL | 90 | 646.51 | SELL | |
| 200 | 572.59 | BUY | 200 | 591.53 | BUY |
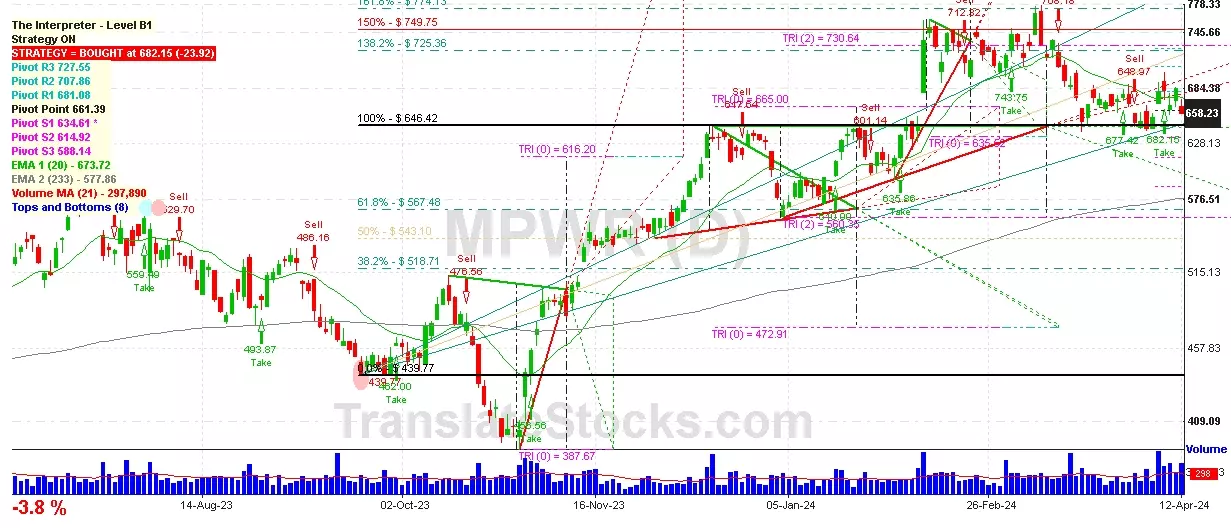
Monolithic Power Systems Inc
IPO: 2004-11-24
Ticker: MPWRIndices: S&P 500,
Exchange: Nasdaq Nms - Global Market (US - USD)
Website: http://www.monolithicpower.com/
Phone:
Common Stock
Manufacturing (
Semiconductors & Related Devices

 Click to Enlarge