| Date | Price $ | Result % | Candle Name | Side |
|---|---|---|---|---|
| 001 11 Apr 2024 | Buy Price: 427.93 | Loss: Close Day2 ($ 413.64) | Abandoned Baby | Buy |
| 002 10 Apr 2024 | Sell Price: 423.26 | Profit: Close Day2 ($ 421.90) | Abandoned Baby | Sell |
| 003 01 Apr 2024 | Buy Price: 424.57 | Loss: Close Day2 ($ 420.45) | Abandoned Baby | Buy |
| 004 23 Feb 2024 | Sell Price: 410.34 | Profit: Close Day1 ($ 407.54) | Dark Cloud Cover | Sell |
| 005 22 Feb 2024 | Buy Price: 411.65 | Profit: Open Day1 ($ 415.67) | Abandoned Baby | Buy |
| 006 14 Feb 2024 | Buy Price: 409.49 | Loss: Close Day2 ($ 404.06) | Abandoned Baby | Buy |
| 007 02 Jan 2024 | Sell Price: 370.87 | Profit: Open Day1 ($ 369.01) | Abandoned Baby | Sell |
| 008 20 Dec 2023 | Sell Price: 370.62 | Loss: Close Day2 ($ 374.58) | Engulfing | Sell |
| 009 20 Dec 2023 | Sell Price: 371.91 | Loss: Close Day2 ($ 374.58) | Dark Cloud Cover | Sell |
| 010 12 Oct 2023 | Sell Price: 331.16 | Profit: Close Day1 ($ 327.73) | Abandoned Baby | Sell |
| 011 31 Aug 2023 | Sell Price: 327.76 | Loss: Close Day2 ($ 333.55) | Engulfing | Sell |
| 012One Year Average | Both Sides Result for 11 Signals |
Loss: $ -22.79 ($ -2.07 / Signal) |
All of Them | Buy + Sell |
| Simple Moving Averages (SMA) Period | Value $ | Signal | Exponential Moving Averages (EMA) Period | Value $ | Signal | |
|---|---|---|---|---|---|---|
| 2 | 414.11 | BUY | 2 | 415.36 | SELL | |
| 3 | 416.71 | SELL | 3 | 416.69 | SELL | |
| 5 | 420.26 | SELL | 5 | 418.60 | SELL | |
| 8 | 422.21 | SELL | 8 | 420.01 | SELL | |
| 13 | 421.75 | SELL | 13 | 420.70 | SELL | |
| 21 | 422.42 | SELL | 21 | 420.12 | SELL | |
| 34 | 418.21 | SELL | 34 | 417.57 | SELL | |
| 55 | 414.43 | BUY | 55 | 411.81 | BUY | |
| 90 | 401.02 | BUY | 90 | 401.12 | BUY | |
| 200 | 366.69 | BUY | 200 | 371.91 | BUY |
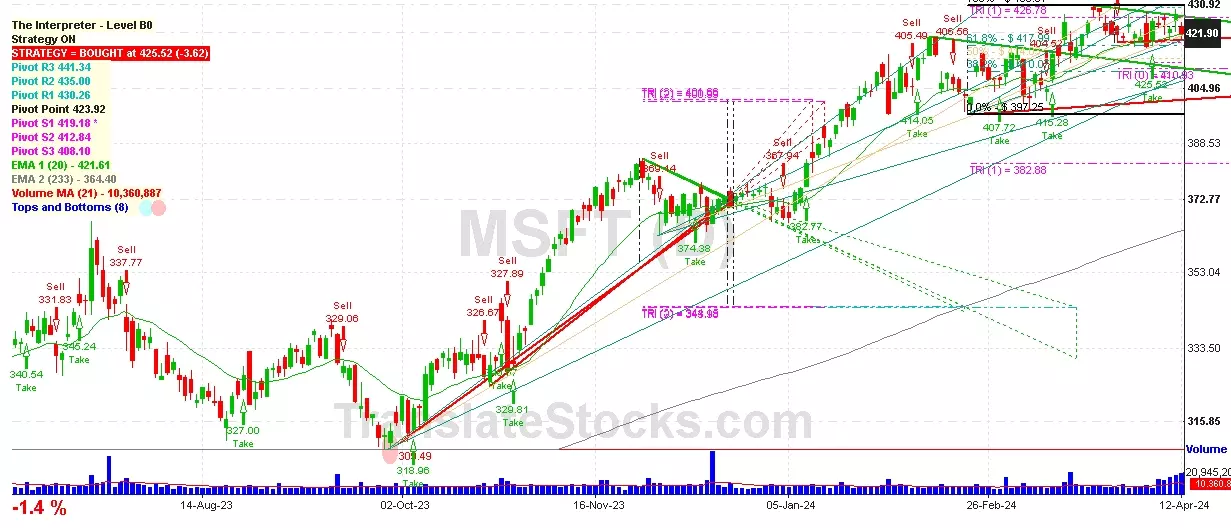
Microsoft Corp
IPO: 1986-03-13
Ticker: MSFTIndices: Dow 30,
S&P 500,
Nasdaq 100,
Exchange: Nasdaq Nms - Global Market (US - USD)
Website: https://www.microsoft.com/en-us
Phone:
Common Stock
Technology (
Services-prepackaged Software

 Click to Enlarge