| Date | Price $ | Result % | Candle Name | Side |
|---|---|---|---|---|
| 001 05 Apr 2024 | Buy Price: 62.04 | Profit: Open Day1 ($ 62.32) | Engulfing | Buy |
| 002 01 Apr 2024 | Sell Price: 62.29 | Profit: Open Day1 ($ 61.75) | Abandoned Baby | Sell |
| 003 12 Mar 2024 | Sell Price: 59.74 | Profit: Open Day1 ($ 59.71) | Abandoned Baby | Sell |
| 004 06 Feb 2024 | Buy Price: 56.32 | Profit: Open Day1 ($ 56.74) | Engulfing | Buy |
| 005 18 Jan 2024 | Buy Price: 56.83 | Profit: Open Day1 ($ 57.03) | Abandoned Baby | Buy |
| 006 17 Nov 2023 | Sell Price: 53.48 | Loss: Close Day2 ($ 54.62) | Dark Cloud Cover | Sell |
| 007 09 Nov 2023 | Sell Price: 51.42 | Loss: Close Day2 ($ 52.09) | Dark Cloud Cover | Sell |
| 008 27 Sep 2023 | Buy Price: 48.33 | Profit: Open Day1 ($ 48.39) | Abandoned Baby | Buy |
| 009 16 Aug 2023 | Buy Price: 50.89 | Profit: Open Day1 ($ 50.95) | Engulfing | Buy |
| 010 16 Aug 2023 | Buy Price: 50.85 | Profit: Open Day1 ($ 50.95) | Piercing Line | Buy |
| 011One Year Average | Both Sides Result for 10 Signals |
Loss: $ -0.12 ($ -0.01 / Signal) |
All of Them | Buy + Sell |
| Simple Moving Averages (SMA) Period | Value $ | Signal | Exponential Moving Averages (EMA) Period | Value $ | Signal | |
|---|---|---|---|---|---|---|
| 2 | 61.30 | BUY | 2 | 61.34 | BUY | |
| 3 | 61.26 | BUY | 3 | 61.21 | BUY | |
| 5 | 60.84 | BUY | 5 | 61.06 | BUY | |
| 8 | 60.56 | BUY | 8 | 61.04 | BUY | |
| 13 | 61.36 | BUY | 13 | 61.12 | BUY | |
| 21 | 61.64 | SELL | 21 | 61.06 | BUY | |
| 34 | 61.16 | BUY | 34 | 60.63 | BUY | |
| 55 | 59.35 | BUY | 55 | 59.79 | BUY | |
| 90 | 58.42 | BUY | 90 | 58.54 | BUY | |
| 200 | 54.51 | BUY | 200 | 58.36 | BUY |
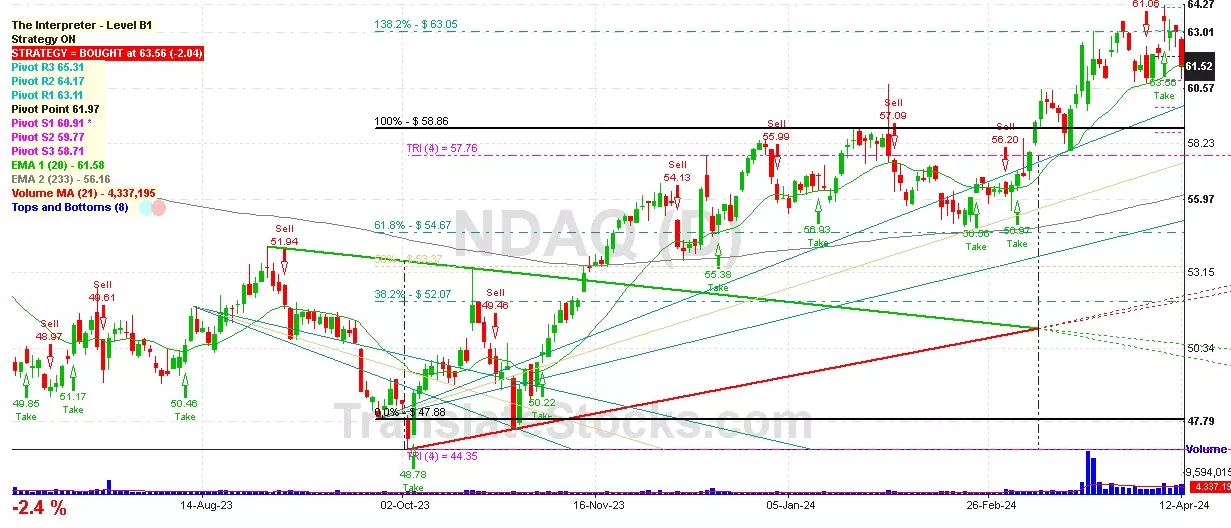
Nasdaq Inc
IPO: 2002-07-01
Ticker: NDAQIndices: S&P 500,
Exchange: Nasdaq Nms - Global Market (US - USD)
Website: https://www.nasdaq.com/
Phone:
Common Stock
Finance (
Security & Commodity Brokers, Dealers, Exchanges & Services

 Click to Enlarge