| Date | Price $ | Result % | Candle Name | Side |
|---|---|---|---|---|
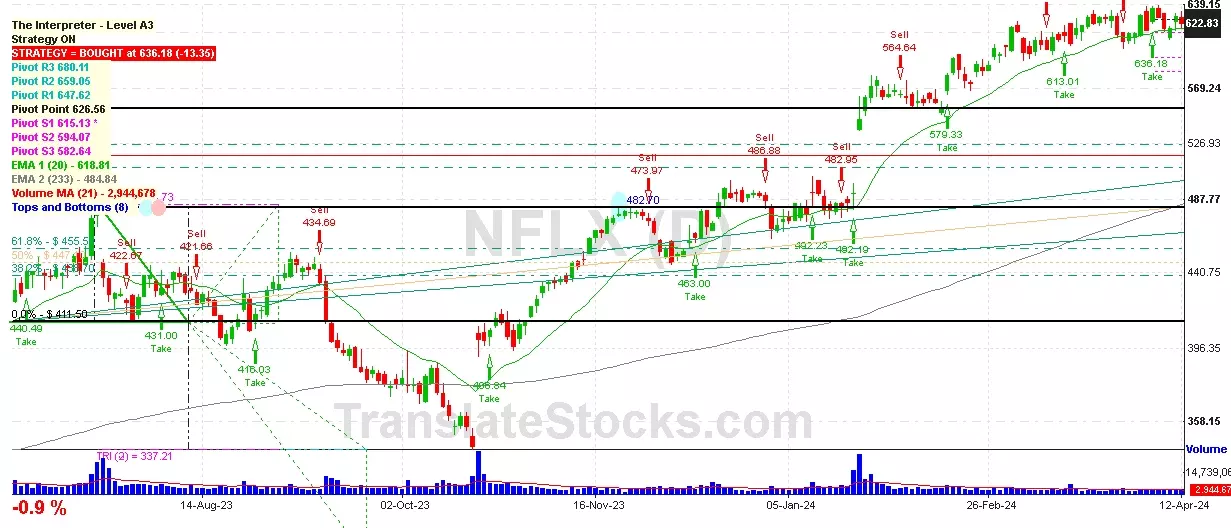
| 001 27 Mar 2024 | Sell Price: 613.53 | Profit: Close Day1 ($ 607.33) | Engulfing | Sell |
| 002 21 Mar 2024 | Sell Price: 622.71 | Loss: Close Day2 ($ 627.46) | Dark Cloud Cover | Sell |
| 003 22 Feb 2024 | Buy Price: 588.47 | Loss: Close Day2 ($ 587.65) | Abandoned Baby | Buy |
| 004 08 Feb 2024 | Sell Price: 557.91 | Profit: Close Day2 ($ 557.85) | Engulfing | Sell |
| 005 08 Feb 2024 | Sell Price: 558.53 | Profit: Close Day2 ($ 557.85) | Dark Cloud Cover | Sell |
| 006 18 Jan 2024 | Buy Price: 485.31 | Profit: Open Day2 ($ 487.55) | Engulfing | Buy |
| 007 05 Jan 2024 | Sell Price: 474.06 | Profit: Open Day1 ($ 473.89) | Dark Cloud Cover | Sell |
| 008 09 Nov 2023 | Sell Price: 435.12 | Loss: Close Day2 ($ 444.62) | Engulfing | Sell |
| 009 09 Nov 2023 | Sell Price: 435.15 | Loss: Close Day2 ($ 444.62) | Dark Cloud Cover | Sell |
| 010 07 Nov 2023 | Sell Price: 433.86 | Loss: Close Day2 ($ 435.15) | Engulfing | Sell |
| 011 07 Nov 2023 | Sell Price: 434.61 | Loss: Close Day2 ($ 435.15) | Dark Cloud Cover | Sell |
| 012 04 Oct 2023 | Buy Price: 377.63 | Profit: Open Day1 ($ 378.01) | Engulfing | Buy |
| 013 04 Oct 2023 | Buy Price: 376.90 | Profit: Open Day1 ($ 378.01) | Piercing Line | Buy |
| 014 17 May 2023 | Buy Price: 339.96 | Profit: Open Day1 ($ 347.25) | Engulfing | Buy |
| 015 27 Apr 2023 | Buy Price: 325.85 | Profit: Close Day1 ($ 329.93) | Abandoned Baby | Buy |
| 016One Year Average | Both Sides Result for 15 Signals |
Loss: $ -4.17 ($ -0.28 / Signal) |
All of Them | Buy + Sell |
| Simple Moving Averages (SMA) Period | Value $ | Signal | Exponential Moving Averages (EMA) Period | Value $ | Signal | |
|---|---|---|---|---|---|---|
| 2 | 612.13 | SELL | 2 | 611.85 | SELL | |
| 3 | 613.92 | SELL | 3 | 612.83 | SELL | |
| 5 | 614.35 | SELL | 5 | 614.55 | SELL | |
| 8 | 617.16 | SELL | 8 | 616.32 | SELL | |
| 13 | 620.26 | SELL | 13 | 617.50 | SELL | |
| 21 | 620.65 | SELL | 21 | 616.36 | SELL | |
| 34 | 616.41 | SELL | 34 | 609.55 | BUY | |
| 55 | 600.54 | BUY | 55 | 593.08 | BUY | |
| 90 | 558.65 | BUY | 90 | 564.86 | BUY | |
| 200 | 484.19 | BUY | 200 | 501.05 | BUY |
Netflix Inc
IPO: 2002-05-29
Ticker: NFLXIndices: S&P 500,
Nasdaq 100,
Exchange: Nasdaq Nms - Global Market (US - USD)
Website: https://www.netflix.com/
Phone:
Common Stock
Trade & Services (
Services-video Tape Rental

 Click to Enlarge