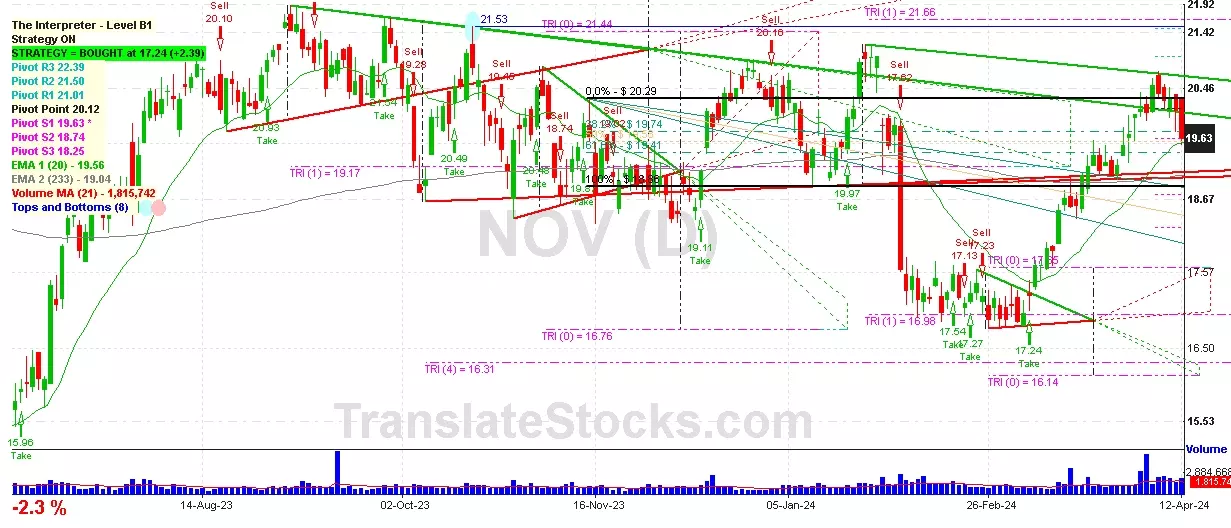
Hey Friend, I'm analysing NOV INC (NOV), and it is between the Support of $ 19.63 (PivotS1) and the Resistance of $ 19.74 (38.2% of Fibonacci). The stock is also approaching the line of PivotS1 at $ 19.63, and if it goes below this line it could reach the next Support of 50% of Fibonacci at $ 19.58. Since it is nailed exactly on the line of $ 19.63, we should wait for another day to better understand which side the stock will move to.

| Date | Price $ | Result % | Candle Name | Side |
|---|---|---|---|---|
| 001 04 Apr 2024 | Sell Price: 20.06 | Loss: Close Day2 ($ 20.38) | Engulfing | Sell |
| 002 04 Apr 2024 | Sell Price: 20.09 | Profit: Open Day1 ($ 20.07) | Dark Cloud Cover | Sell |
| 003 26 Mar 2024 | Sell Price: 19.05 | Loss: Close Day2 ($ 19.52) | Engulfing | Sell |
| 004 15 Mar 2024 | Sell Price: 18.56 | Profit: Open Day2 ($ 18.52) | Engulfing | Sell |
| 005 15 Mar 2024 | Sell Price: 18.59 | Profit: Close Day1 ($ 18.57) | Dark Cloud Cover | Sell |
| 006 23 Feb 2024 | Sell Price: 17.23 | Profit: Open Day1 ($ 17.10) | Abandoned Baby | Sell |
| 007 18 Jan 2024 | Buy Price: 19.47 | Profit: Open Day1 ($ 19.57) | Abandoned Baby | Buy |
| 008 27 Dec 2023 | Sell Price: 20.76 | Profit: Open Day1 ($ 20.56) | Abandoned Baby | Sell |
| 009 24 Nov 2023 | Buy Price: 19.07 | Profit: Close Day1 ($ 19.17) | Abandoned Baby | Buy |
| 010 01 Nov 2023 | Sell Price: 19.69 | Loss: Close Day2 ($ 20.34) | Engulfing | Sell |
| 011 05 Sep 2023 | Sell Price: 21.47 | Profit: Open Day1 ($ 21.45) | Engulfing | Sell |
| 012 18 Aug 2023 | Buy Price: 20.62 | Loss: Close Day2 ($ 20.24) | Piercing Line | Buy |
| 013 09 Aug 2023 | Buy Price: 20.49 | Profit: Close Day1 ($ 20.64) | Abandoned Baby | Buy |
| 014 07 Aug 2023 | Sell Price: 20.29 | Profit: Open Day1 ($ 19.78) | Abandoned Baby | Sell |
| 015 07 Aug 2023 | Sell Price: 20.27 | Profit: Open Day1 ($ 19.78) | Engulfing | Sell |
| 016 04 May 2023 | Buy Price: 15.35 | Profit: Open Day1 ($ 15.87) | Engulfing | Buy |
| 017One Year Average | Both Sides Result for 16 Signals |
Profit: $ 0.48 ($ 0.03 / Signal) |
All of Them | Buy + Sell |
| Simple Moving Averages (SMA) Period | Value $ | Signal | Exponential Moving Averages (EMA) Period | Value $ | Signal | |
|---|---|---|---|---|---|---|
| 2 | 18.85 | SELL | 2 | 18.81 | BUY | |
| 3 | 18.76 | BUY | 3 | 18.79 | BUY | |
| 5 | 18.71 | BUY | 5 | 18.81 | BUY | |
| 8 | 18.75 | BUY | 8 | 18.91 | SELL | |
| 13 | 19.28 | SELL | 13 | 19.06 | SELL | |
| 21 | 19.47 | SELL | 21 | 19.11 | SELL | |
| 34 | 19.12 | SELL | 34 | 19.03 | SELL | |
| 55 | 18.38 | BUY | 55 | 18.95 | SELL | |
| 90 | 19.00 | SELL | 90 | 18.97 | SELL | |
| 200 | 19.46 | SELL | 200 | 19.05 | SELL |
Nov Inc
IPO: 1996-10-29
Ticker: NOVIndices: S&P 500,
Exchange: New York Stock Exchange, Inc. (US - USD)
Website: http://www.nov.com
Phone:
Common Stock
Technology (
Oil & Gas Field Machinery & Equipment
 Click to Enlarge