| Date | Price $ | Result % | Candle Name | Side |
|---|---|---|---|---|
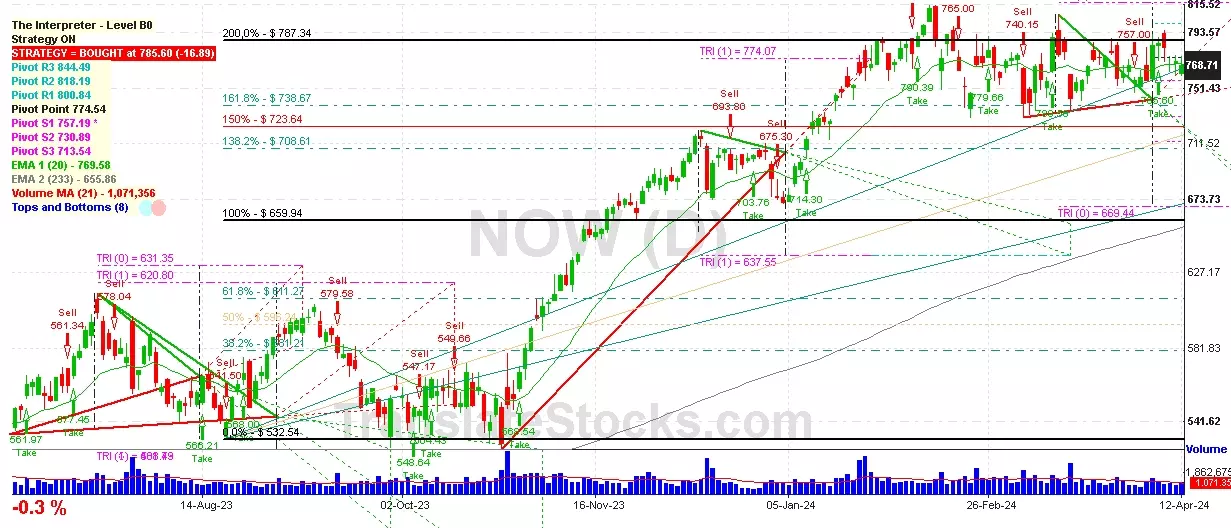
| 001 25 Mar 2024 | Buy Price: 774.64 | Profit: Open Day1 ($ 778.99) | Piercing Line | Buy |
| 002 13 Oct 2023 | Sell Price: 549.66 | Loss: Close Day2 ($ 568.47) | Abandoned Baby | Sell |
| 003 31 May 2023 | Sell Price: 544.78 | Profit: Open Day1 ($ 534.80) | Abandoned Baby | Sell |
| 004One Year Average | Both Sides Result for 3 Signals |
Loss: $ -4.48 ($ -1.49 / Signal) |
All of Them | Buy + Sell |
| Simple Moving Averages (SMA) Period | Value $ | Signal | Exponential Moving Averages (EMA) Period | Value $ | Signal | |
|---|---|---|---|---|---|---|
| 2 | 740.62 | SELL | 2 | 739.49 | SELL | |
| 3 | 739.01 | SELL | 3 | 742.76 | SELL | |
| 5 | 751.42 | SELL | 5 | 748.67 | SELL | |
| 8 | 761.76 | SELL | 8 | 754.32 | SELL | |
| 13 | 763.05 | SELL | 13 | 758.91 | SELL | |
| 21 | 765.05 | SELL | 21 | 761.88 | SELL | |
| 34 | 764.60 | SELL | 34 | 762.42 | SELL | |
| 55 | 769.28 | SELL | 55 | 756.23 | SELL | |
| 90 | 748.33 | SELL | 90 | 736.62 | SELL | |
| 200 | 658.84 | BUY | 200 | 672.25 | BUY |
Servicenow Inc
IPO: 2012-06-29
Ticker: NOWIndices: S&P 500,
Exchange: New York Stock Exchange, Inc. (US - USD)
Website: https://www.servicenow.com/
Phone:
Common Stock
Technology (
Services-prepackaged Software

 Click to Enlarge